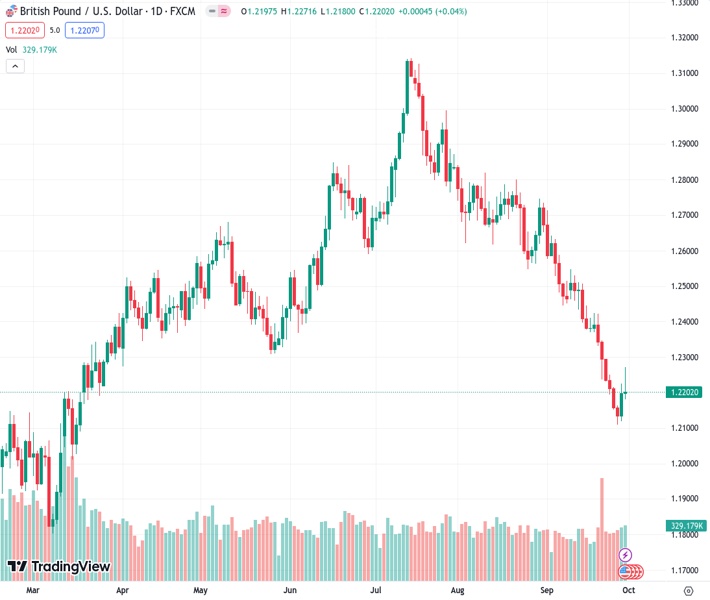
The GBPUSD currency pair initially experienced an increase on Friday, but later dropped due to a general shift in the market towards the US Dollar.
…
This is a premium post.
[s2If !current_user_can(access_s2member_level4)]Please register for FREE REGISTER to read full post below containing analysis. In case of any error or you think you are not able to read the full post below, please email us at support#nehcap.com [lwa][/s2If] [s2If current_user_can(access_s2member_level1)]
- The GBP/USD initially rose on Friday, but got knocked lower as the market broadly swept back into the US Dollar.
The pair currently trades last at 1.21971.
The previous day high was 1.2225 while the previous day low was 1.212. The daily 38.2% Fib levels comes at 1.2185, expected to provide support. Similarly, the daily 61.8% fib level is at 1.216, expected to provide support.
The GBP/USD sank just south of the 1.2200 handle heading into the Friday market close, and the pair finds itself still struggling under the weight of a heavy bearish trend.
Inflation continues to be a hot topic for the Bank of England (BoE), and the UK may have no choice but to continue facing down high interest rates. With prices continuing to grow above the BoE’s target, interest rate cuts remain a far-off dream for market investors hoping to get their borrowing and funding costs eased.
UK labor conditions continue to deteriorate, and the manufacturing outlook remains pessimistic looking forward.
Next week the UK will see Manufacturing Purchasing Manager Index (PMI) figures for September; the PMI data is broadly expected to show continued deterioration in economic expectations.
The US Dollar (USD) is set to remain well-bid through next week’s trading window. An impending US government shutdown is seeing the Greenback bolstered across the broader market, and a government shutdown could see next week’s Non-Farm Payrolls delayed.
Read More:
Forex Today: Another positive week for the Dollar
Pound Sterling fails to hold recovery as US Dollar recovers
The Sterling got rejected from the 200-hour Simple Moving Average after peaking at an intraday high of 1.2270 on Friday, sending the pair into a fresh low of 1.2180 for the day.
The GBP/USD is currently pinned to the midpoint at the 34-hour Exponential Moving Average (EMA) as intraday momentum bleeds out, and the midweek’s bounce from a near-term low if 1.2110 looks set to run out of steam.
Daily candlesticks have the GBP/USD deeply off the beaten path, tumbling away from the 200-day SMA currently parked just above 1.2400, and the pair is set to continue charging into fresh six-month lows is selling pressure keeps up.
A descending 34-day EMA is providing dynamic resistance for any potential bullish pullbacks, and is currently priced in at the 200-day SMA, looking for a bearish crossover.
Technical Levels: Supports and Resistances
GBPUSD currently trading at 1.2199 at the time of writing. Pair opened at 1.22 and is trading with a change of -0.01 % .
| Overview | Overview.1 | |
|---|---|---|
| 0 | Today last price | 1.2199 |
| 1 | Today Daily Change | -0.0001 |
| 2 | Today Daily Change % | -0.0100 |
| 3 | Today daily open | 1.2200 |
The pair remains strongly bearish on the daily time frame. It trades below the 20 SMA @ 1.2394, 50 SMA 1.2602, 100 SMA @ 1.2626 and 200 SMA @ 1.2435.
| Trends | Trends.1 | |
|---|---|---|
| 0 | Daily SMA20 | 1.2394 |
| 1 | Daily SMA50 | 1.2602 |
| 2 | Daily SMA100 | 1.2626 |
| 3 | Daily SMA200 | 1.2435 |
The previous day high was 1.2225 while the previous day low was 1.212. The daily 38.2% Fib levels comes at 1.2185, expected to provide support. Similarly, the daily 61.8% fib level is at 1.216, expected to provide support.
Note the levels of interest below:
- Pivot support is noted at 1.2139, 1.2077, 1.2034
- Pivot resistance is noted at 1.2243, 1.2286, 1.2348
| Levels | Levels.1 |
|---|---|
| Previous Daily High | 1.2225 |
| Previous Daily Low | 1.2120 |
| Previous Weekly High | 1.2425 |
| Previous Weekly Low | 1.2231 |
| Previous Monthly High | 1.2841 |
| Previous Monthly Low | 1.2548 |
| Daily Fibonacci 38.2% | 1.2185 |
| Daily Fibonacci 61.8% | 1.2160 |
| Daily Pivot Point S1 | 1.2139 |
| Daily Pivot Point S2 | 1.2077 |
| Daily Pivot Point S3 | 1.2034 |
| Daily Pivot Point R1 | 1.2243 |
| Daily Pivot Point R2 | 1.2286 |
| Daily Pivot Point R3 | 1.2348 |
[/s2If]
Download Nehcap EAWe have two EAs that are operational on our LIVE accounts.
- EA-FIX: Check out the details here. Download EA-FIX . EA-FIX is a non-grid HFT scalper.
- EA-GROWTH: High quality low dd EA using trend grids. Download EA_GROWTHJoin Our Telegram Group
")


