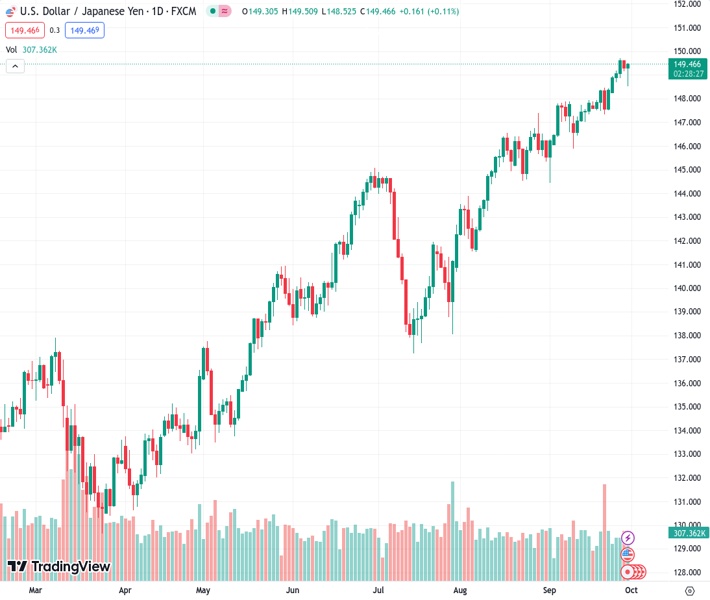
The USDJPY pair, currently trading at 149.474, has rebounded to approximately 149.40, indicating a gain of 0.12% following the release of US Core PCE data. This data shows a year-on-year increase of 3.9%, which is slightly below the expected 4%.
…
This is a premium post.
[s2If !current_user_can(access_s2member_level4)]Please register for FREE REGISTER to read full post below containing analysis. In case of any error or you think you are not able to read the full post below, please email us at support#nehcap.com [lwa][/s2If] [s2If current_user_can(access_s2member_level1)]
- USD/JPY recovers to around 149.40, gaining 0.12%, after US Core PCE data reveals a 3.9% YoY increase, below the anticipated 4%.
The pair currently trades last at 149.474.
The previous day high was 149.64 while the previous day low was 149.15. The daily 38.2% Fib levels comes at 149.33, expected to provide support. Similarly, the daily 61.8% fib level is at 149.45, expected to provide support.
The US Dollar (USD) stages a recovery against the Japanese Yen (JPY) in the mid-North American session, reclaiming the 149.00 figure after dipping towards the 148.52 daily low during the Asian and European session. Nevertheless, bounced off the lows and hovers at around 149.40s, gaining 0.12%.
Data revealed from the United States (US) showed inflation is cooling, as August´s Core Personal Consumption Expenditures (PCE), the US Federal Reserve (Fed) preferred gauge for inflation, expanded by 3.9% YoY, below estimates of 4%. At the same time, headline inflation grew by 3.5% YoY as expected, above July’s 3.4%.
Even though the latest Fed officials had stressed that further tightening is needed, other policymakers are taking a cautious approach. Meanwhile, expectations for a rate hike in November lowered as shown by the CME FedWatch Tool,
Other data revealed the University of Michigan (UoM) showed that Consumer Sentiment for September’s final reading deteriorated, while inflation expectations ticked up to 3.2% from 3.1% for one year. Americans see inflation at 2.8% on a five-year horizon, up from 2.7%.
On the Japanese front, intervention threats in the Forex markets continued, though contradicting what Japanese authorities said regarding that moves should be justified by fundamentals. Consequently, the dovish stance of the Bank of Japan (BoJ) suggests further JPY weakness is justified. This week, BoJ Governor Kazuo Ueda cited that discussing an exit from the ultra-loose monetary policy would be premature as inflation above 2% is not governed by wage growth.
On Thursday, Japanese Finance Minister Shunichi Suzuki reiterated that he won’t rule out any steps to respond if there’s excessive FX volatility. He added that authority is closely watching FX’s moves with a sense of urgency.
Given the fundamental backdrop, the USD/JPY could test the 150.00 mark, but intervention threats, might refrain buyers from opening fresh long positions.
Technical Levels: Supports and Resistances
USDJPY currently trading at 149.39 at the time of writing. Pair opened at 149.31 and is trading with a change of 0.05 % .
| Overview | Overview.1 | |
|---|---|---|
| 0 | Today last price | 149.39 |
| 1 | Today Daily Change | 0.08 |
| 2 | Today Daily Change % | 0.05 |
| 3 | Today daily open | 149.31 |
The pair remains strongly bullish on the daily timeframe. It trades above its 20 SMA @ 147.82, 50 SMA 145.52, 100 SMA @ 143.02 and 200 SMA @ 137.95.
| Trends | Trends.1 | |
|---|---|---|
| 0 | Daily SMA20 | 147.82 |
| 1 | Daily SMA50 | 145.52 |
| 2 | Daily SMA100 | 143.02 |
| 3 | Daily SMA200 | 137.95 |
The previous day high was 149.64 while the previous day low was 149.15. The daily 38.2% Fib levels comes at 149.33, expected to provide support. Similarly, the daily 61.8% fib level is at 149.45, expected to provide support.
Note the levels of interest below:
- Pivot support is noted at 149.09, 148.87, 148.59
- Pivot resistance is noted at 149.59, 149.86, 150.08
| Levels | Levels.1 |
|---|---|
| Previous Daily High | 149.64 |
| Previous Daily Low | 149.15 |
| Previous Weekly High | 148.46 |
| Previous Weekly Low | 147.32 |
| Previous Monthly High | 147.38 |
| Previous Monthly Low | 141.51 |
| Daily Fibonacci 38.2% | 149.33 |
| Daily Fibonacci 61.8% | 149.45 |
| Daily Pivot Point S1 | 149.09 |
| Daily Pivot Point S2 | 148.87 |
| Daily Pivot Point S3 | 148.59 |
| Daily Pivot Point R1 | 149.59 |
| Daily Pivot Point R2 | 149.86 |
| Daily Pivot Point R3 | 150.08 |
[/s2If]
Download Nehcap EAWe have two EAs that are operational on our LIVE accounts.
- EA-FIX: Check out the details here. Download EA-FIX . EA-FIX is a non-grid HFT scalper.
- EA-GROWTH: High quality low dd EA using trend grids. Download EA_GROWTHJoin Our Telegram Group
")


