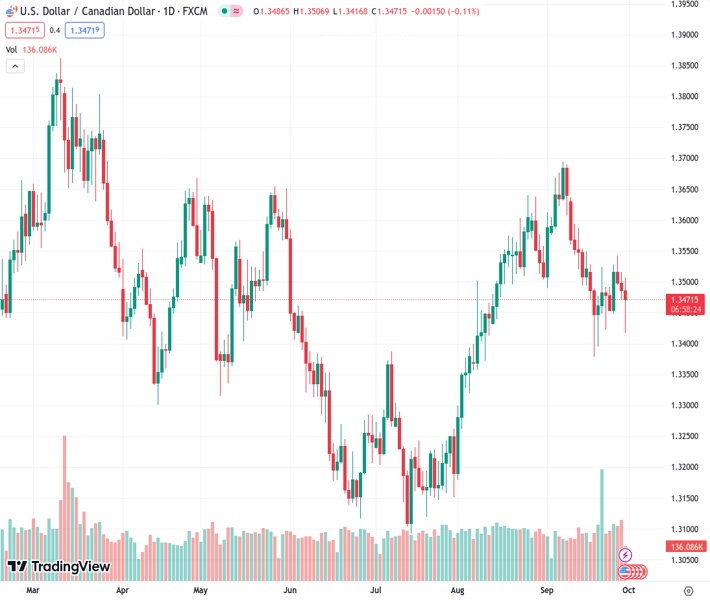
On account of Canada’s unchanging GDP and weak US core PCE data, the USDCAD currency pair at 1.34693 has found some support around the 1.3420 level.
…
This is a premium post.
[s2If !current_user_can(access_s2member_level4)]Please register for FREE REGISTER to read full post below containing analysis. In case of any error or you think you are not able to read the full post below, please email us at support#nehcap.com [lwa][/s2If] [s2If current_user_can(access_s2member_level1)]
- USD/CAD discovers a cushion near 1.3420 on Canada’s stagnant GDP and soft US core PCE data.
The pair currently trades last at 1.34693.
The previous day high was 1.3516 while the previous day low was 1.347. The daily 38.2% Fib levels comes at 1.3488, expected to provide resistance. Similarly, the daily 61.8% fib level is at 1.3499, expected to provide resistance.
The USD/CAD pair discovered buying interest near 1.3420 in the early New York session. The Loonie asset finds support after Canada’s weak monthly Gross Domestic Product (GDP) and soft United States Personal Consumption Expenditure (PCE) price index reports.
The US Bureau of Labor Statistics reported that monthly core PCE expanded at a nominal pace of 0.1% in August against expectations and the former release of 0.2%. The annualized PCE has softened to 3.9% as expected from the former release of 4.3%.
Headline PCE grew by 0.4%, doubling from July’s pace but remained slower than expectations of 0.5%. The headline data was expected to remain hot due to rising energy prices. Monetary receipts at oil stations were significantly higher as global oil prices have rallied more than 30% in the past three months.
A decline in core expenditure data may soften consumer inflation ahead and would discourage Federal Reserve (Fed) policymakers from raising interest rates further. Meanwhile, chances that interest rates will remain steady at 5.25%-5.50% at the November monetary policy meeting have recovered to 83% from 77% on Thursday, according to the CME Fedwatch tool.
The US Dollar Index (DXY) finds interim support near 105.70. Further action in the US Dollar will be guided by the US ISM Manufacturing PMI report for September, which will be published on Monday.
Meanwhile, the Canadian Dollar comes under pressure as Canada’s growth rate remained stagnant in July while investors anticipated a nominal growth at 0.1%. In June, the GDP contracted 0.2%. On the oil front, oil prices retreat after a short-lived pullback to near $93.00 as global slowdown fears remain intact.
It is worth noting that Canada is the leading exporter of oil to the United States and a decline in oil prices impacts the Canadian Dollar.
Technical Levels: Supports and Resistances
USDCAD currently trading at 1.3444 at the time of writing. Pair opened at 1.3487 and is trading with a change of -0.32 % .
| Overview | Overview.1 | |
|---|---|---|
| 0 | Today last price | 1.3444 |
| 1 | Today Daily Change | -0.0043 |
| 2 | Today Daily Change % | -0.3200 |
| 3 | Today daily open | 1.3487 |
The pair is trading below its 20 Daily moving average @ 1.3541, below its 50 Daily moving average @ 1.3466 , above its 100 Daily moving average @ 1.3403 and below its 200 Daily moving average @ 1.3459
| Trends | Trends.1 | |
|---|---|---|
| 0 | Daily SMA20 | 1.3541 |
| 1 | Daily SMA50 | 1.3466 |
| 2 | Daily SMA100 | 1.3403 |
| 3 | Daily SMA200 | 1.3459 |
The previous day high was 1.3516 while the previous day low was 1.347. The daily 38.2% Fib levels comes at 1.3488, expected to provide resistance. Similarly, the daily 61.8% fib level is at 1.3499, expected to provide resistance.
Note the levels of interest below:
- Pivot support is noted at 1.3466, 1.3445, 1.342
- Pivot resistance is noted at 1.3512, 1.3537, 1.3558
| Levels | Levels.1 |
|---|---|
| Previous Daily High | 1.3516 |
| Previous Daily Low | 1.3470 |
| Previous Weekly High | 1.3528 |
| Previous Weekly Low | 1.3379 |
| Previous Monthly High | 1.3640 |
| Previous Monthly Low | 1.3184 |
| Daily Fibonacci 38.2% | 1.3488 |
| Daily Fibonacci 61.8% | 1.3499 |
| Daily Pivot Point S1 | 1.3466 |
| Daily Pivot Point S2 | 1.3445 |
| Daily Pivot Point S3 | 1.3420 |
| Daily Pivot Point R1 | 1.3512 |
| Daily Pivot Point R2 | 1.3537 |
| Daily Pivot Point R3 | 1.3558 |
[/s2If]
Download Nehcap EAWe have two EAs that are operational on our LIVE accounts.
- EA-FIX: Check out the details here. Download EA-FIX . EA-FIX is a non-grid HFT scalper.
- EA-GROWTH: High quality low dd EA using trend grids. Download EA_GROWTHJoin Our Telegram Group
")


