The price of silver rises quickly, reaching nearly $23.20, as the US core PCE data turns out to be lower than expected.
…
This is a premium post.
[s2If !current_user_can(access_s2member_level4)]Please register for FREE REGISTER to read full post below containing analysis. In case of any error or you think you are not able to read the full post below, please email us at support#nehcap.com [lwa][/s2If] [s2If current_user_can(access_s2member_level1)]
- Silver price rises swiftly to near $23.20 as US core PCE remains softer-than-anticipated.
The pair currently trades last at 23.305.
The previous day high was 22.74 while the previous day low was 22.4. The daily 38.2% Fib levels comes at 22.61, expected to provide support. Similarly, the daily 61.8% fib level is at 22.53, expected to provide support.
Silver price rallies $23.20 as the United States Bureau of Economic Analysis reports a soft core Personal Consumption Expenditure (PCE) price index. The monthly Core PCE grew at a nominal pace of 0.1%, slower than expectations and the former pace of 0.2%. The annual core PCE data decelerated to 3.9% as expected against July’s reading of 4.3%.
The headline PCE expanded at a higher pace of 0.4% vs. July’s reading of 0.2% but slower than expectations of 0.5%. On an annualized basis, the economic data accelerated nominally to 3.5% as expected due to rising energy prices.
The US Dollar Index (DXY) corrects to near 105.80 but the broader bias remains bullish as the US economy has remained resilient. The US economy is performing well on the grounds of inflation, labor market, and consumer spending but factory activity is still a concern for the authorities amid a poor demand outlook.
This week, the Durable Goods Orders data for August unexpectedly rose by 0.2% while investors forecasted a contraction of 0.5%. This indicates that business spending on equipment increases, as investors see the Federal Reserve (Fed) is done with hiking interest rates and the factory outlook, is improving. For more guidance on the current status of the manufacturing sector, investors will focus on the ISM Manufacturing PMI report for September, which will be released on Monday at 14:00 GMT.
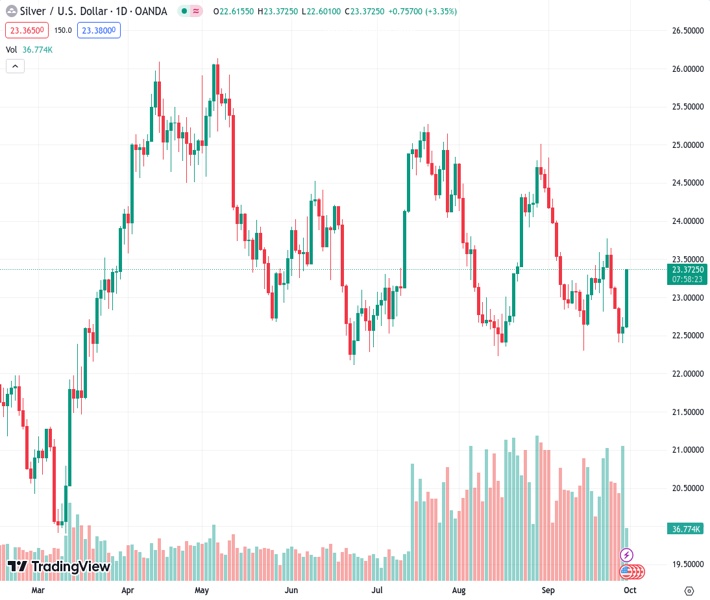
Silver price rebounds strongly from the neckline of the Head and Shoulder chart pattern, which is plotted from June 23 low at $22.11. The asset forms an H&S chart pattern on a daily scale, which indicates a prolonged consolidation whose breakdown triggers a bearish reversal. The white metal trades below the 20-day Exponential Moving Average (EMA) at $23.15, which indicates that the short-term trend is bearish.
The Relative Strength Index (RSI) (14) slips below 40.00, indicating no signs of divergence and oversold, warranting more downside.
Technical Levels: Supports and Resistances
XAGUSD currently trading at 23.17 at the time of writing. Pair opened at 22.62 and is trading with a change of 2.43 % .
| Overview | Overview.1 | |
|---|---|---|
| 0 | Today last price | 23.17 |
| 1 | Today Daily Change | 0.55 |
| 2 | Today Daily Change % | 2.43 |
| 3 | Today daily open | 22.62 |
The pair remains strongly bearish on the daily time frame. It trades below the 20 SMA @ 23.17, 50 SMA 23.49, 100 SMA @ 23.53 and 200 SMA @ 23.46.
| Trends | Trends.1 | |
|---|---|---|
| 0 | Daily SMA20 | 23.17 |
| 1 | Daily SMA50 | 23.49 |
| 2 | Daily SMA100 | 23.53 |
| 3 | Daily SMA200 | 23.46 |
The previous day high was 22.74 while the previous day low was 22.4. The daily 38.2% Fib levels comes at 22.61, expected to provide support. Similarly, the daily 61.8% fib level is at 22.53, expected to provide support.
Note the levels of interest below:
- Pivot support is noted at 22.43, 22.25, 22.1
- Pivot resistance is noted at 22.77, 22.92, 23.11
| Levels | Levels.1 |
|---|---|
| Previous Daily High | 22.74 |
| Previous Daily Low | 22.40 |
| Previous Weekly High | 23.78 |
| Previous Weekly Low | 22.81 |
| Previous Monthly High | 25.02 |
| Previous Monthly Low | 22.23 |
| Daily Fibonacci 38.2% | 22.61 |
| Daily Fibonacci 61.8% | 22.53 |
| Daily Pivot Point S1 | 22.43 |
| Daily Pivot Point S2 | 22.25 |
| Daily Pivot Point S3 | 22.10 |
| Daily Pivot Point R1 | 22.77 |
| Daily Pivot Point R2 | 22.92 |
| Daily Pivot Point R3 | 23.11 |
[/s2If]
Download Nehcap EAWe have two EAs that are operational on our LIVE accounts.
- EA-FIX: Check out the details here. Download EA-FIX . EA-FIX is a non-grid HFT scalper.
- EA-GROWTH: High quality low dd EA using trend grids. Download EA_GROWTHJoin Our Telegram Group
")


