After the weak Consumer Price Index (CPI) data from Japan, the USDJPY currency pair experiences a rise in support.
…
This is a premium post.
[s2If !current_user_can(access_s2member_level4)]Please register for FREE REGISTER to read full post below containing analysis. In case of any error or you think you are not able to read the full post below, please email us at support#nehcap.com [lwa][/s2If] [s2If current_user_can(access_s2member_level1)]
- USD/JPY receives upward support after the soft Japan’s CPI.
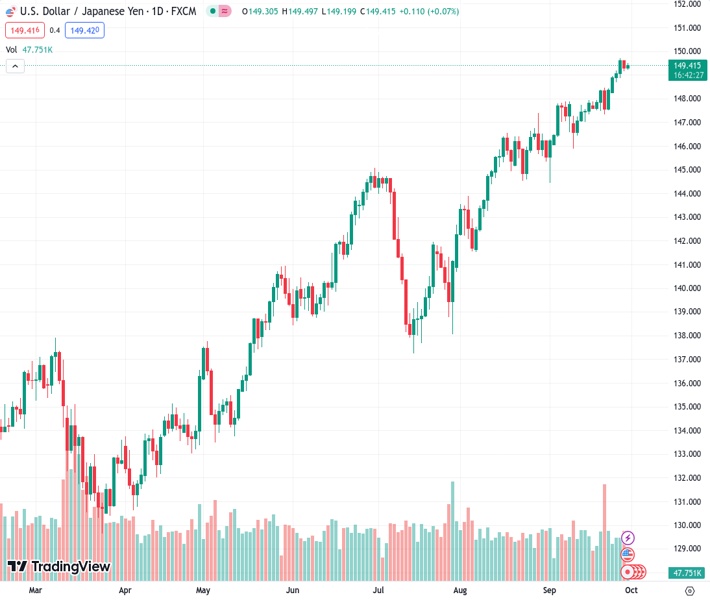
The pair currently trades last at 149.408.
The previous day high was 149.64 while the previous day low was 149.15. The daily 38.2% Fib levels comes at 149.33, expected to provide support. Similarly, the daily 61.8% fib level is at 149.45, expected to provide resistance.
USD/JPY recovers from the recent losses, trading higher around 149.40 during the Asian session on Friday. The pair receives upward support after the downbeat Japanese data released on Friday.
Statistics Bureau of Japan published the headline Tokyo Consumer Price Index (CPI) on a yearly basis rose 2.8% in September slightly lower than the previous 2.9% readings. Core CPI (YoY) increased 3.8%, which was 4.0% in August.
Japan’s inflation continues to surpass the Bank of Japan’s (BoJ) 2% target, but the central bank is expected to maintain its ultra-loose monetary policy until it is confident that inflation will consistently remain above its minimum target.
The US Dollar Index (DXY) extends losses on the second day after the moderate datasets from the United States (US), trading lower around 106.00 by the press time.
US GDP kept consistent at 2.1% as expected. Initial Jobless Claims for the week ending on September 22, improved to 204K from the 202K prior, falling short of the 215K expected.
US Pending Home Sales showed a decline of 7.1%, exceeding the market expectation of a 0.8% fall, swinging from the 0.9% rise previously.
However, the yield on the 10-year US Treasury bond retraces the recent losses, standing at 4.60% at the time of writing. The improved US yields could put a cap on the losses of the US Dollar (USD).
The US Dollar (USD) saw a strong rally over the past week, buoyed by robust economic indicators, and it climbed to its highest levels since December. Furthermore, the USD’s resilience can be linked to the favorable performance of US Treasury yields.
Chicago Fed President Austan Goolsbee also highlighted the rare opportunity to achieve this without a recession, indicating the US Federal Reserve’s (Fed) commitment to managing inflation while sustaining economic growth.
Fed President Thomas Barkin acknowledged that recent inflation data has been positive but emphasized that it’s premature to determine the future course of monetary policy.
Traders await the US Core Personal Consumption Expenditure (PCE) Price Index, the Fed’s preferred measure of consumer inflation, which is due on Friday. The annual rate is expected to reduce from 4.2% to 3.9%.
Technical Levels: Supports and Resistances
USDJPY currently trading at 149.42 at the time of writing. Pair opened at 149.31 and is trading with a change of 0.07 % .
| Overview | Overview.1 | |
|---|---|---|
| 0 | Today last price | 149.42 |
| 1 | Today Daily Change | 0.11 |
| 2 | Today Daily Change % | 0.07 |
| 3 | Today daily open | 149.31 |
The pair remains strongly bullish on the daily timeframe. It trades above its 20 SMA @ 147.82, 50 SMA 145.52, 100 SMA @ 143.02 and 200 SMA @ 137.95.
| Trends | Trends.1 | |
|---|---|---|
| 0 | Daily SMA20 | 147.82 |
| 1 | Daily SMA50 | 145.52 |
| 2 | Daily SMA100 | 143.02 |
| 3 | Daily SMA200 | 137.95 |
The previous day high was 149.64 while the previous day low was 149.15. The daily 38.2% Fib levels comes at 149.33, expected to provide support. Similarly, the daily 61.8% fib level is at 149.45, expected to provide resistance.
Note the levels of interest below:
- Pivot support is noted at 149.09, 148.87, 148.59
- Pivot resistance is noted at 149.59, 149.86, 150.08
| Levels | Levels.1 |
|---|---|
| Previous Daily High | 149.64 |
| Previous Daily Low | 149.15 |
| Previous Weekly High | 148.46 |
| Previous Weekly Low | 147.32 |
| Previous Monthly High | 147.38 |
| Previous Monthly Low | 141.51 |
| Daily Fibonacci 38.2% | 149.33 |
| Daily Fibonacci 61.8% | 149.45 |
| Daily Pivot Point S1 | 149.09 |
| Daily Pivot Point S2 | 148.87 |
| Daily Pivot Point S3 | 148.59 |
| Daily Pivot Point R1 | 149.59 |
| Daily Pivot Point R2 | 149.86 |
| Daily Pivot Point R3 | 150.08 |
[/s2If]
Download Nehcap EAWe have two EAs that are operational on our LIVE accounts.
- EA-FIX: Check out the details here. Download EA-FIX . EA-FIX is a non-grid HFT scalper.
- EA-GROWTH: High quality low dd EA using trend grids. Download EA_GROWTHJoin Our Telegram Group


