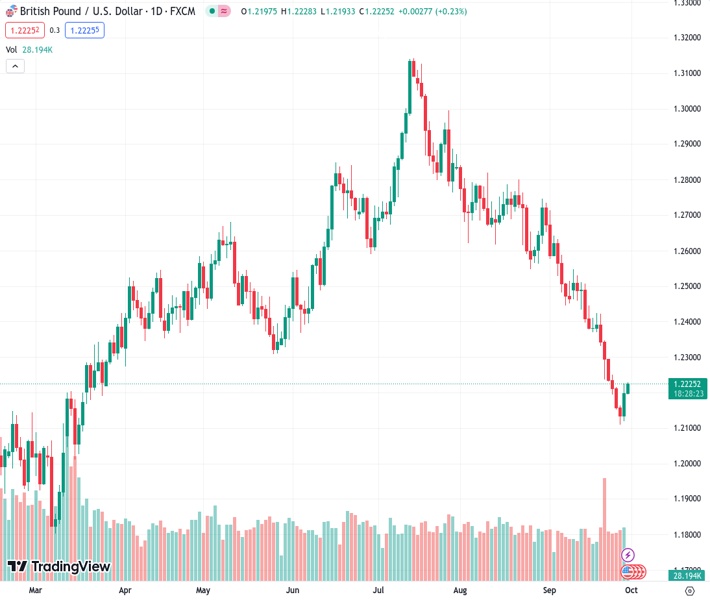
The GBPUSD pair, currently at a rate of 1.22265, is gathering interest from buyers for the second consecutive day, thanks to a weaker US dollar providing support.
…
This is a premium post.
[s2If !current_user_can(access_s2member_level4)]Please register for FREE REGISTER to read full post below containing analysis. In case of any error or you think you are not able to read the full post below, please email us at support#nehcap.com [lwa][/s2If] [s2If current_user_can(access_s2member_level1)]
- GBP/USD attracts some buying for the second straight day and is supported by a softer USD.
The pair currently trades last at 1.22265.
The previous day high was 1.2225 while the previous day low was 1.212. The daily 38.2% Fib levels comes at 1.2185, expected to provide support. Similarly, the daily 61.8% fib level is at 1.216, expected to provide support.
The GBP/USD pair gains some positive traction for the second successive day on Friday and looks to build on the previous day’s goodish recovery from the vicinity of its lowest level since March 17. Spot prices trade around the 1.2220 region during the Asian session and draw support from a mildly softer tone surrounding the US Dollar (USD).
The USD Index (DXY), which tracks the Greenback against a basket of currencies, remains depressed below the YTD peak set earlier this week and is pressured by Thursday’s rather unimpressive US macro data. The final estimate published by the US Bureau of Economic Analysis (BEA) showed that the US expanded by a 2.1% annualized pace during the second quarter, in line with market expectations. Furthermore, the Labor Department reported that Initial Jobless Claims rose by 2,000 to 204K during the week ended September 23. This, along with a modest fall in the US Treasury bond yields and a stable performance around the equity markets, undermines the safe-haven buck and acts as a tailwind for the GBP/USD pair.
The US macro data, however, still pointed to a resilient economy and ensured that the Federal Reserve (Fed) would keep interest rates higher for longer. This should help limit the downside for the US bond yields and lend support to the Greenback. Traders might also refrain from placing aggressive directional bets and prefer to wait for the release of the US Core PCE Price Index – the Fed’s preferred inflation gauge. The US central bank warned last week that still-sticky inflation in the US was likely to attract at least one more interest rate hike by the end of this year. Hence, the data will influence expectations about the Fed’s future rate-hike path, which, in turn, should provide a fresh impetus to the USD and drive the GBP/USD pair.
Heading into the key data risk, traders might take cues from the release of the final UK GDP print, though the immediate market reaction to a positive surprise is more likely to remain limited on the back of the Bank of England’s surprise pause in its rate-hiking cycle earlier this month. Moreover, the UK central bank provided little hints of its intends to raise rates any further. This, in turn, warrants some caution for bullish traders and positioning for any further appreciating move for the GBP/USD pair. Hence, it will be prudent to wait for strong follow-through buying before confirming that spot prices have formed a near-term bottom ahead of the 1.2100 round-figure mark.
Technical Levels: Supports and Resistances
GBPUSD currently trading at 1.222 at the time of writing. Pair opened at 1.22 and is trading with a change of 0.16 % .
| Overview | Overview.1 | |
|---|---|---|
| 0 | Today last price | 1.222 |
| 1 | Today Daily Change | 0.002 |
| 2 | Today Daily Change % | 0.160 |
| 3 | Today daily open | 1.220 |
The pair remains strongly bearish on the daily time frame. It trades below the 20 SMA @ 1.2394, 50 SMA 1.2602, 100 SMA @ 1.2626 and 200 SMA @ 1.2435.
| Trends | Trends.1 | |
|---|---|---|
| 0 | Daily SMA20 | 1.2394 |
| 1 | Daily SMA50 | 1.2602 |
| 2 | Daily SMA100 | 1.2626 |
| 3 | Daily SMA200 | 1.2435 |
The previous day high was 1.2225 while the previous day low was 1.212. The daily 38.2% Fib levels comes at 1.2185, expected to provide support. Similarly, the daily 61.8% fib level is at 1.216, expected to provide support.
Note the levels of interest below:
- Pivot support is noted at 1.2139, 1.2077, 1.2034
- Pivot resistance is noted at 1.2243, 1.2286, 1.2348
| Levels | Levels.1 |
|---|---|
| Previous Daily High | 1.2225 |
| Previous Daily Low | 1.2120 |
| Previous Weekly High | 1.2425 |
| Previous Weekly Low | 1.2231 |
| Previous Monthly High | 1.2841 |
| Previous Monthly Low | 1.2548 |
| Daily Fibonacci 38.2% | 1.2185 |
| Daily Fibonacci 61.8% | 1.2160 |
| Daily Pivot Point S1 | 1.2139 |
| Daily Pivot Point S2 | 1.2077 |
| Daily Pivot Point S3 | 1.2034 |
| Daily Pivot Point R1 | 1.2243 |
| Daily Pivot Point R2 | 1.2286 |
| Daily Pivot Point R3 | 1.2348 |
[/s2If]
Download Nehcap EAWe have two EAs that are operational on our LIVE accounts.
- EA-FIX: Check out the details here. Download EA-FIX . EA-FIX is a non-grid HFT scalper.
- EA-GROWTH: High quality low dd EA using trend grids. Download EA_GROWTHJoin Our Telegram Group


