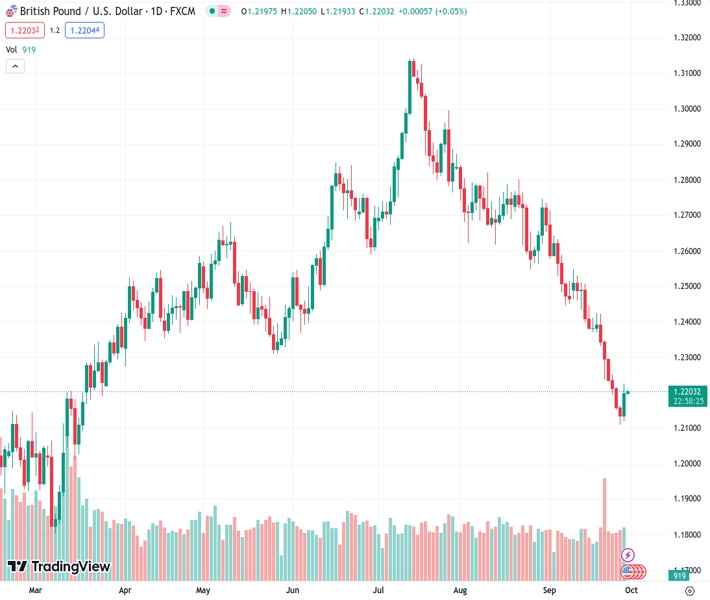
The GBPUSD pair experienced a slight increase on Thursday, reaching the level of 1.2200.
…
This is a premium post.
[s2If !current_user_can(access_s2member_level4)]Please register for FREE REGISTER to read full post below containing analysis. In case of any error or you think you are not able to read the full post below, please email us at support#nehcap.com [lwa][/s2If] [s2If current_user_can(access_s2member_level1)]
- The GBP/USD caught some lift on Thursday, rising back to the 1.2200 handle.
The pair currently trades last at 1.22035.
The previous day high was 1.2166 while the previous day low was 1.2111. The daily 38.2% Fib levels comes at 1.2132, expected to provide support. Similarly, the daily 61.8% fib level is at 1.2145, expected to provide support.
The GBP/USD managed to eke out a minor recovery on Friday, owing more to a step back in the broad-market US Dollar Index (DXY) than any intrinsic strength to be found in the Pound Sterling (GBP).
Market analysts broadly expect the GBP to continue to weaken moving forward, and a continued backslide to the 1.2000 major handle is all but a foregone conclusion for many instutitions.
The upcoming Friday trading session will kick things off for the GBP/USD with UK Gross Domestic Product figures due at 06:00 GMT. The UK GDP for the second quarter is forecast to hold steady at 0.2%, and a miss for headline economic growth in the British economy is all set to see the Pound lose what little gains it’s recovered for Thursday.
Friday also brings high-impact data for the USD, most notably the Personal Consumption Expenditure (PCE) Price Index at 12:30 GMT. The PCE numbers are expected to hold steady at 0.2% for the month of August, with the annualized figure for the same period seen ticking down from 4.2% to 3.9%.
US figures hit a middling note on Thursday, with US Initial Jobless Claims clocking in at 204K versus the previous 202K; US annualized GDP for the second quarter came in exactly at expectations at 2.1%.
The big miss for Thursday was US Pending Home Sales, which surprised to the downside by not-insignificant -7.1%, far below the forecast -0.8% and dropping away from the previous 0.9%.
Read More:
GBP/USD remains vulnerable to the 1.20/1.21 area – ING
The Pound and Euro should weaken substantially through early 2024 – Wells Fargo
GBP/USD needs to surpass 1.2350 to show more meaningful technical strength – Scotiabank
The GBP/USD rose half a percent on Thursday, lifting to a session high of 1.2220 after pinging into six-month lows at 1.2110 the previous day.
Hourly candles have the pair rising into technical support coming down from the bearish 200-hour Simple Moving Average (SMA) near 1.2260.
On daily candlesticks the GBP/USD is firmly bearish and potentially primed for a minor relief rally. Price action will be capped off by the 200-day SMA above 1.2400, and the 34-day Exponential Moving Average (EMA) is racing to make a bearish cross of the longer moving average.
the GBP/USD is over 7% off its last meaningful swing high in July at 1.3140.
Technical Levels: Supports and Resistances
GBPUSD currently trading at 1.2204 at the time of writing. Pair opened at 1.2135 and is trading with a change of 0.57 % .
| Overview | Overview.1 | |
|---|---|---|
| 0 | Today last price | 1.2204 |
| 1 | Today Daily Change | 0.0069 |
| 2 | Today Daily Change % | 0.5700 |
| 3 | Today daily open | 1.2135 |
The pair remains strongly bearish on the daily time frame. It trades below the 20 SMA @ 1.2417, 50 SMA 1.2615, 100 SMA @ 1.2629 and 200 SMA @ 1.2435.
| Trends | Trends.1 | |
|---|---|---|
| 0 | Daily SMA20 | 1.2417 |
| 1 | Daily SMA50 | 1.2615 |
| 2 | Daily SMA100 | 1.2629 |
| 3 | Daily SMA200 | 1.2435 |
The previous day high was 1.2166 while the previous day low was 1.2111. The daily 38.2% Fib levels comes at 1.2132, expected to provide support. Similarly, the daily 61.8% fib level is at 1.2145, expected to provide support.
Note the levels of interest below:
- Pivot support is noted at 1.2108, 1.2082, 1.2053
- Pivot resistance is noted at 1.2164, 1.2193, 1.222
| Levels | Levels.1 |
|---|---|
| Previous Daily High | 1.2166 |
| Previous Daily Low | 1.2111 |
| Previous Weekly High | 1.2425 |
| Previous Weekly Low | 1.2231 |
| Previous Monthly High | 1.2841 |
| Previous Monthly Low | 1.2548 |
| Daily Fibonacci 38.2% | 1.2132 |
| Daily Fibonacci 61.8% | 1.2145 |
| Daily Pivot Point S1 | 1.2108 |
| Daily Pivot Point S2 | 1.2082 |
| Daily Pivot Point S3 | 1.2053 |
| Daily Pivot Point R1 | 1.2164 |
| Daily Pivot Point R2 | 1.2193 |
| Daily Pivot Point R3 | 1.2220 |
[/s2If]
Download Nehcap EAWe have two EAs that are operational on our LIVE accounts.
- EA-FIX: Check out the details here. Download EA-FIX . EA-FIX is a non-grid HFT scalper.
- EA-GROWTH: High quality low dd EA using trend grids. Download EA_GROWTHJoin Our Telegram Group


