The US Dollar is trying to bounce back and the price of oil is dropping, causing buying interest to emerge around 1.3500 in the USDCAD trading pair.
…
This is a premium post.
[s2If !current_user_can(access_s2member_level4)]Please register for FREE REGISTER to read full post below containing analysis. In case of any error or you think you are not able to read the full post below, please email us at support#nehcap.com [lwa][/s2If] [s2If current_user_can(access_s2member_level1)]
- USD/CAD finds buying interest near 1.3500 as the US Dollar attempts to recover and oil price falls.
The pair currently trades last at 1.34952.
The previous day high was 1.3543 while the previous day low was 1.3495. The daily 38.2% Fib levels comes at 1.3514, expected to provide resistance. Similarly, the daily 61.8% fib level is at 1.3525, expected to provide resistance.
The USD/CAD pair found support after a corrective move to near the psychological support of 1.3500 in the early New York session. The recovery in the Loonie asset is supported by a rebound in the US Dollar and a sharp decline in oil prices.
Earlier, the US Dollar Index (DXY) corrected to near 106.20 as the risk appetite of the market participants improved. While the broader bias in the US Dollar remains upbeat as the US economy is absorbing the consequences of higher interest rates by the Federal Reserve (Fed).
Going forward, the Canadian Dollar will dance to the tune of the monthly Gross Domestic Product (GDP) data for July, which will be published on Friday at 12:30 GMT. As per estimates, the Canadian economy grew by a nominal pace of 0.1%. In June, the GDP data contracted by 0.2%.
USD/CAD tests the breakout region of the Symmetrical Triangle chart pattern formed on a two-hour scale. A breakout of the aforementioned chart pattern results in wider ticks and heavy buying volume. The broader trend is still bearish as the asset is trading below the 200-day Exponential Moving Average (EMA), which trades around 1.3512.
The Relative Strength Index (RSI) (14) trades in the 40.00-60.00 range, which signifies consolidation.
A decisive break above September 21 high at 1.3524 would drive the asset towards September 11 low around 1.3560, followed by the round-level resistance at 1.3600.
In an alternate scenario, a breakdown below September 25 low around 1.3450 would drag the asset toward September 20 low near 1.3400. A further breakdown could expose the asset to six-week low near 1.3356.
Technical Levels: Supports and Resistances
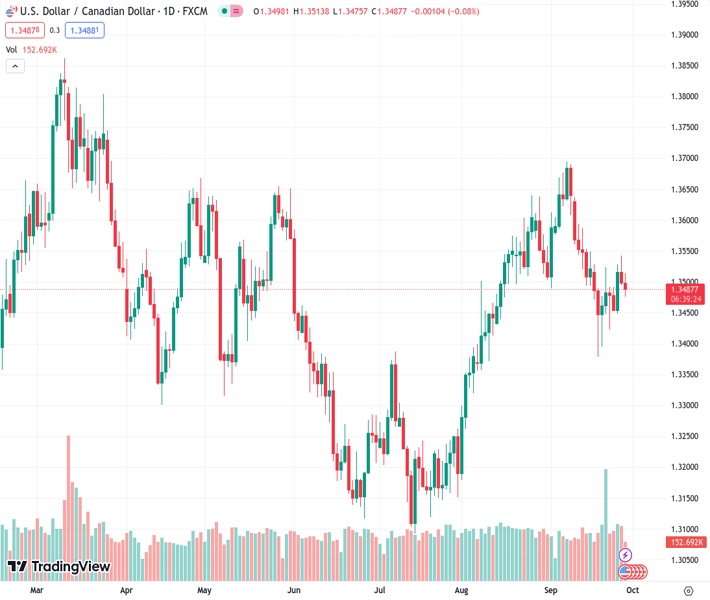
USDCAD currently trading at 1.3489 at the time of writing. Pair opened at 1.3499 and is trading with a change of -0.07 % .
| Overview | Overview.1 | |
|---|---|---|
| 0 | Today last price | 1.3489 |
| 1 | Today Daily Change | -0.0010 |
| 2 | Today Daily Change % | -0.0700 |
| 3 | Today daily open | 1.3499 |
The pair is trading below its 20 Daily moving average @ 1.3542, above its 50 Daily moving average @ 1.346 , above its 100 Daily moving average @ 1.3403 and above its 200 Daily moving average @ 1.3459
| Trends | Trends.1 | |
|---|---|---|
| 0 | Daily SMA20 | 1.3542 |
| 1 | Daily SMA50 | 1.3460 |
| 2 | Daily SMA100 | 1.3403 |
| 3 | Daily SMA200 | 1.3459 |
The previous day high was 1.3543 while the previous day low was 1.3495. The daily 38.2% Fib levels comes at 1.3514, expected to provide resistance. Similarly, the daily 61.8% fib level is at 1.3525, expected to provide resistance.
Note the levels of interest below:
- Pivot support is noted at 1.3482, 1.3464, 1.3434
- Pivot resistance is noted at 1.353, 1.356, 1.3577
| Levels | Levels.1 |
|---|---|
| Previous Daily High | 1.3543 |
| Previous Daily Low | 1.3495 |
| Previous Weekly High | 1.3528 |
| Previous Weekly Low | 1.3379 |
| Previous Monthly High | 1.3640 |
| Previous Monthly Low | 1.3184 |
| Daily Fibonacci 38.2% | 1.3514 |
| Daily Fibonacci 61.8% | 1.3525 |
| Daily Pivot Point S1 | 1.3482 |
| Daily Pivot Point S2 | 1.3464 |
| Daily Pivot Point S3 | 1.3434 |
| Daily Pivot Point R1 | 1.3530 |
| Daily Pivot Point R2 | 1.3560 |
| Daily Pivot Point R3 | 1.3577 |
[/s2If]
Download Nehcap EAWe have two EAs that are operational on our LIVE accounts.
- EA-FIX: Check out the details here. Download EA-FIX . EA-FIX is a non-grid HFT scalper.
- EA-GROWTH: High quality low dd EA using trend grids. Download EA_GROWTHJoin Our Telegram Group


