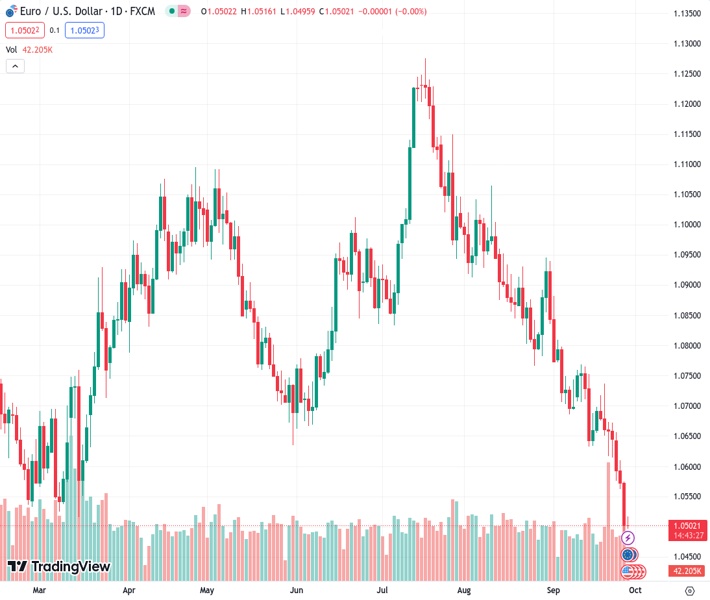
The EUR/USD currency pair is making efforts to remain above the significant psychological level of 1.0500.
…
This is a premium post.
[s2If !current_user_can(access_s2member_level4)]Please register for FREE REGISTER to read full post below containing analysis. In case of any error or you think you are not able to read the full post below, please email us at support#nehcap.com [lwa][/s2If] [s2If current_user_can(access_s2member_level1)]
- EUR/USD attempts to stay above the 1.0500 psychological level.
The pair currently trades last at 1.05062.
The previous day high was 1.0575 while the previous day low was 1.0488. The daily 38.2% Fib levels comes at 1.0521, expected to provide resistance. Similarly, the daily 61.8% fib level is at 1.0542, expected to provide resistance.
EUR/USD attempts to snap the losing streak that began on September 19, hovering around 1.0500 psychological level during the Asian session on Thursday. The pair is under pressure due to risk aversion, coupled with upbeat US Treasury yields and economic data.
On Wednesday, Germany’s downbeat Gfk Consumer Confidence Survey exerted pressure on the EUR/USD pair. The consumer sentiment revealed a decline of -26.5 in October from -25.6 prior.
The current downward momentum in EUR/USD appears to have a potential bearish bias, given that the 14-day Relative Strength Index (RSI) remains below the 50 level. However, there is a support region around January’s low at 1.0481 that may pose a challenge for further losses.
If there’s a breakthrough below the level, it could lead the EUR/USD bears to navigate the area around the psychological level at 1.0450.
On the upside, the EUR/USD pair may encounter significant resistance levels in its price movement. The seven-day Exponential Moving Average (EMA) at 1.0575 could act as a barrier, followed by the 1.0600 psychological level.
If the pair breaks above the latter, it may then explore the region around the 23.6% Fibonacci retracement at 1.0673.
The Moving Average Convergence Divergence (MACD) indicator is providing a bearish signal for the EUR/USD pair. The MACD line lies below the centerline and the signal line. This configuration suggests that there is potentially weak momentum in the price movement.
Technical Levels: Supports and Resistances
EURUSD currently trading at 1.0509 at the time of writing. Pair opened at 1.0503 and is trading with a change of 0.06 % .
| Overview | Overview.1 | |
|---|---|---|
| 0 | Today last price | 1.0509 |
| 1 | Today Daily Change | 0.0006 |
| 2 | Today Daily Change % | 0.0600 |
| 3 | Today daily open | 1.0503 |
The pair remains strongly bearish on the daily time frame. It trades below the 20 SMA @ 1.069, 50 SMA 1.0845, 100 SMA @ 1.0865 and 200 SMA @ 1.0829.
| Trends | Trends.1 | |
|---|---|---|
| 0 | Daily SMA20 | 1.0690 |
| 1 | Daily SMA50 | 1.0845 |
| 2 | Daily SMA100 | 1.0865 |
| 3 | Daily SMA200 | 1.0829 |
The previous day high was 1.0575 while the previous day low was 1.0488. The daily 38.2% Fib levels comes at 1.0521, expected to provide resistance. Similarly, the daily 61.8% fib level is at 1.0542, expected to provide resistance.
Note the levels of interest below:
- Pivot support is noted at 1.0469, 1.0435, 1.0383
- Pivot resistance is noted at 1.0556, 1.0608, 1.0642
| Levels | Levels.1 |
|---|---|
| Previous Daily High | 1.0575 |
| Previous Daily Low | 1.0488 |
| Previous Weekly High | 1.0737 |
| Previous Weekly Low | 1.0615 |
| Previous Monthly High | 1.1065 |
| Previous Monthly Low | 1.0766 |
| Daily Fibonacci 38.2% | 1.0521 |
| Daily Fibonacci 61.8% | 1.0542 |
| Daily Pivot Point S1 | 1.0469 |
| Daily Pivot Point S2 | 1.0435 |
| Daily Pivot Point S3 | 1.0383 |
| Daily Pivot Point R1 | 1.0556 |
| Daily Pivot Point R2 | 1.0608 |
| Daily Pivot Point R3 | 1.0642 |
[/s2If]
Download Nehcap EAWe have two EAs that are operational on our LIVE accounts.
- EA-FIX: Check out the details here. Download EA-FIX . EA-FIX is a non-grid HFT scalper.
- EA-GROWTH: High quality low dd EA using trend grids. Download EA_GROWTHJoin Our Telegram Group


