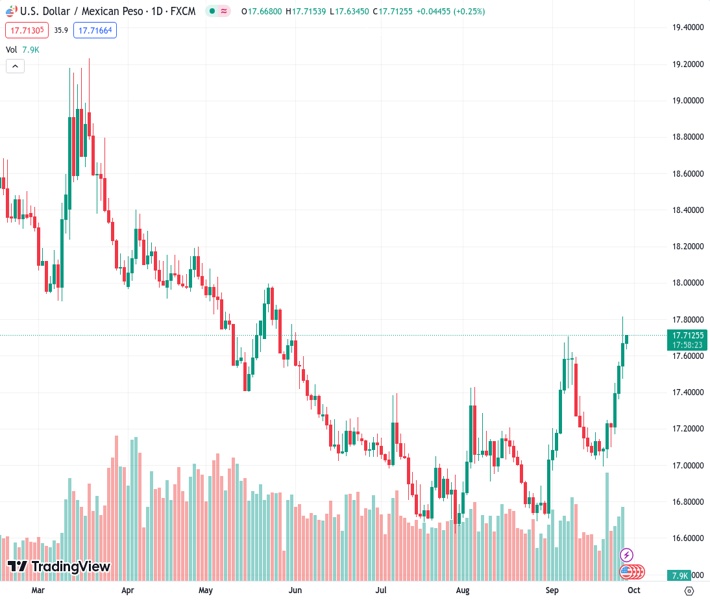
Due to concerns over the Federal Reserve’s future interest rate decisions, the US dollar to Mexican peso exchange rate remains strong at 17.7130.
…
This is a premium post.
[s2If !current_user_can(access_s2member_level4)]Please register for FREE REGISTER to read full post below containing analysis. In case of any error or you think you are not able to read the full post below, please email us at support#nehcap.com [lwa][/s2If] [s2If current_user_can(access_s2member_level1)]
- USD/MXN continues to strengthen due to market caution on the Fed’s interest rate trajectory.
The pair currently trades last at 17.7130.
The previous day high was 17.8174 while the previous day low was 17.4769. The daily 38.2% Fib levels comes at 17.6873, expected to provide support. Similarly, the daily 61.8% fib level is at 17.607, expected to provide support.
USD/MXN continues the winning streak that began on Monday, trading higher around 17.7110 during the Asian session on Thursday. The pair experiences upward support due to risk aversion, higher US Treasury yields, and economic data.
The US Dollar Index (DXY) extends its gains at its highest levels since December, hovering around 106.70 by the press time. The DXY is bolstered by solid macroeconomic data from the United States (US). US Dollar’s (USD) strength is attributed to the positive performance of US Treasury yields over an impending US government shutdown.
The yield on the 10-year US Treasury note has reached record highs, standing at 4.61% at the time of writing.
The bullish momentum of the USD is being strengthened by the hawkish comments from Federal Reserve (Fed) board members. Neel Kashkari, President of the Minneapolis Federal Reserve, recently made statements indicating the potential for further interest rate hikes in the future.
Additionally, Kashkari suggested that the option of keeping interest rates unchanged at their current levels remains open, especially if any potential rate cuts are postponed even further. These remarks from Fed officials are contributing to the upward trajectory of the Greenback.
In August, US Durable Goods Orders rebounded with a 0.2% increase, a notable turnaround from the previous month’s 5.6% decline. This performance exceeded market expectations, which had anticipated a 0.5% decline.
Regarding EIA Crude Oil Stocks Change data for the week ending September 22, showing a decrease with a reading of -2.17 million barrels, compared to the previous reading of -2.135 million barrels. This index was expected to be published at -0.32 million barrels figures.
Mexico’s President, Andres Manuel Lopez Obrador, has acknowledged the effective performance of the Bank of Mexico (Banxico) as inflation rates decrease. However, the President has also emphasized the importance of Banxico focusing more on fostering economic development.
If the trend of declining inflation persists, Banxico might contemplate making changes to its monetary policy. These potential adjustments could have repercussions on the value of the Mexican Peso against the US Dollar.
Market participants will likely watch Mexico’s Jobless Rate for August and the Bank of Mexico (Banxico) interest rate decision on Thursday. On the US docket, the Core Personal Consumption Expenditure (PCE) Price Index, the Fed’s preferred measure of consumer inflation will be eyed on Friday, which is expected to reduce from 4.2% to 3.9%.
Technical Levels: Supports and Resistances
USDMXN currently trading at 17.7128 at the time of writing. Pair opened at 17.6698 and is trading with a change of 0.24 % .
| Overview | Overview.1 | |
|---|---|---|
| 0 | Today last price | 17.7128 |
| 1 | Today Daily Change | 0.0430 |
| 2 | Today Daily Change % | 0.2400 |
| 3 | Today daily open | 17.6698 |
The pair is trading above its 20 Daily moving average @ 17.2851, above its 50 Daily moving average @ 17.0864 , above its 100 Daily moving average @ 17.1905 and below its 200 Daily moving average @ 17.859
| Trends | Trends.1 | |
|---|---|---|
| 0 | Daily SMA20 | 17.2851 |
| 1 | Daily SMA50 | 17.0864 |
| 2 | Daily SMA100 | 17.1905 |
| 3 | Daily SMA200 | 17.8590 |
The previous day high was 17.8174 while the previous day low was 17.4769. The daily 38.2% Fib levels comes at 17.6873, expected to provide support. Similarly, the daily 61.8% fib level is at 17.607, expected to provide support.
Note the levels of interest below:
- Pivot support is noted at 17.4921, 17.3143, 17.1516
- Pivot resistance is noted at 17.8325, 17.9952, 18.173
| Levels | Levels.1 |
|---|---|
| Previous Daily High | 17.8174 |
| Previous Daily Low | 17.4769 |
| Previous Weekly High | 17.2506 |
| Previous Weekly Low | 16.9982 |
| Previous Monthly High | 17.4274 |
| Previous Monthly Low | 16.6945 |
| Daily Fibonacci 38.2% | 17.6873 |
| Daily Fibonacci 61.8% | 17.6070 |
| Daily Pivot Point S1 | 17.4921 |
| Daily Pivot Point S2 | 17.3143 |
| Daily Pivot Point S3 | 17.1516 |
| Daily Pivot Point R1 | 17.8325 |
| Daily Pivot Point R2 | 17.9952 |
| Daily Pivot Point R3 | 18.1730 |
[/s2If]
Download Nehcap EAWe have two EAs that are operational on our LIVE accounts.
- EA-FIX: Check out the details here. Download EA-FIX . EA-FIX is a non-grid HFT scalper.
- EA-GROWTH: High quality low dd EA using trend grids. Download EA_GROWTHJoin Our Telegram Group


