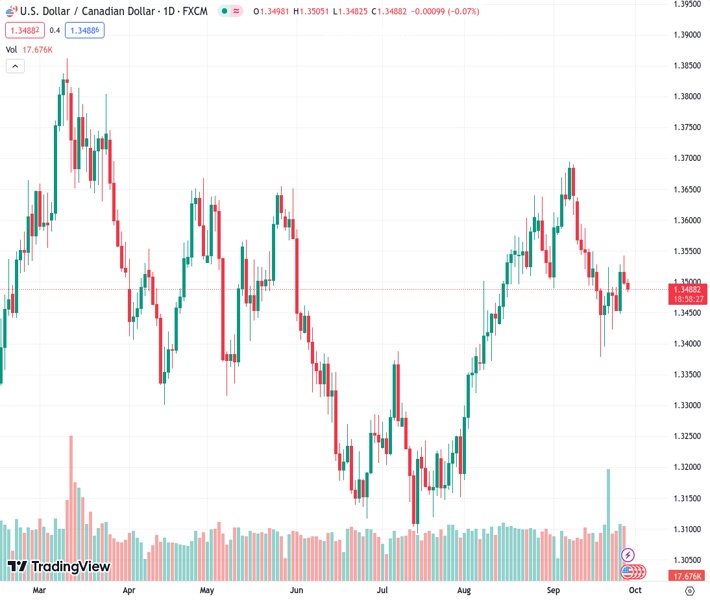
The USDCAD pair has been declining for the second consecutive day and moving further away from its recent high point of over one week.
…
This is a premium post.
[s2If !current_user_can(access_s2member_level4)]Please register for FREE REGISTER to read full post below containing analysis. In case of any error or you think you are not able to read the full post below, please email us at support#nehcap.com [lwa][/s2If] [s2If current_user_can(access_s2member_level1)]
- USD/CAD drifts lower for the second straight day and retreats further from over a one-week high.
The pair currently trades last at 1.34869.
The previous day high was 1.3543 while the previous day low was 1.3495. The daily 38.2% Fib levels comes at 1.3514, expected to provide resistance. Similarly, the daily 61.8% fib level is at 1.3525, expected to provide resistance.
The USD/CAD pair extends the overnight retracement slide from the vicinity of mid-1.3500s, or a one-and-half-week high and remains under some selling pressure for the second successive day on Thursday. The steady descent drags spot prices further below the 1.3500 psychological mark during the Asian session and is sponsored by surging Crude Oil prices.
In fact, Oil prices jump to over a one-year high on continued signs of tighter global supply and some optimism over an economic recovery in China – the world’s largest oil importer. US crude inventories shrank by a bigger-than-expected 2.2 million barrels (mb) in the week to September 22, marking the fifth week of draws in the previous seven. This, in turn, outweighs worries about economic headwinds stemming from rapidly rising borrowing costs and continues to act as a tailwind for the black liquid, which, in turn, is seen underpinning the commodity-linked Loonie and weighing on the USD/CAD pair.
The US Dollar (USD), on the other hand, consolidates its recent strong gains to the highest level since November 2022 and does little to influence the USD/CAD pair. Any meaningful USD corrective slide, however, still seems elusive in the wake of firming expectations for further policy tightening by the Federal Reserve (Fed). Investors now seem convinced that the Fed will keep rates higher for longer and have been pricing in the possibility of at least one more lift-off by the end of this year. The bets were reaffirmed by the overnight hawkish comments by Minneapolis Fed President Neel Kashkari.
It is not clear yet whether the central bank is finished raising rates amid ample evidence of ongoing economic strength, Kashkari noted. Adding to this, the better-than-expected release of the US Durable Goods Orders raised hopes for a stronger third-quarter GDP growth, which should allow the Fed to stick to its hawkish stance. This led to an extended selloff in the US fixed-income market, pushing the yield on the benchmark 10-year US government bond to a fresh 16-year peak, further beyond the 4.50% threshold, and should continue to act as a tailwind for the Greenback.
The aforementioned fundamental backdrop makes it prudent to wait for strong follow-through selling before positioning for any further depreciating move for the USD/CAD pair. Traders now look to the release of the final US Q2 GDP print, due later during the early North American session, which, along with the US bond yields, will drive the USD demand. Apart from this, Oil price dynamics provide some impetus to the USD/CAD pair and allow traders to grab short-term opportunities.
Technical Levels: Supports and Resistances
USDCAD currently trading at 1.3487 at the time of writing. Pair opened at 1.3499 and is trading with a change of -0.09 % .
| Overview | Overview.1 | |
|---|---|---|
| 0 | Today last price | 1.3487 |
| 1 | Today Daily Change | -0.0012 |
| 2 | Today Daily Change % | -0.0900 |
| 3 | Today daily open | 1.3499 |
The pair is trading below its 20 Daily moving average @ 1.3542, above its 50 Daily moving average @ 1.346 , above its 100 Daily moving average @ 1.3403 and above its 200 Daily moving average @ 1.3459
| Trends | Trends.1 | |
|---|---|---|
| 0 | Daily SMA20 | 1.3542 |
| 1 | Daily SMA50 | 1.3460 |
| 2 | Daily SMA100 | 1.3403 |
| 3 | Daily SMA200 | 1.3459 |
The previous day high was 1.3543 while the previous day low was 1.3495. The daily 38.2% Fib levels comes at 1.3514, expected to provide resistance. Similarly, the daily 61.8% fib level is at 1.3525, expected to provide resistance.
Note the levels of interest below:
- Pivot support is noted at 1.3482, 1.3464, 1.3434
- Pivot resistance is noted at 1.353, 1.356, 1.3577
| Levels | Levels.1 |
|---|---|
| Previous Daily High | 1.3543 |
| Previous Daily Low | 1.3495 |
| Previous Weekly High | 1.3528 |
| Previous Weekly Low | 1.3379 |
| Previous Monthly High | 1.3640 |
| Previous Monthly Low | 1.3184 |
| Daily Fibonacci 38.2% | 1.3514 |
| Daily Fibonacci 61.8% | 1.3525 |
| Daily Pivot Point S1 | 1.3482 |
| Daily Pivot Point S2 | 1.3464 |
| Daily Pivot Point S3 | 1.3434 |
| Daily Pivot Point R1 | 1.3530 |
| Daily Pivot Point R2 | 1.3560 |
| Daily Pivot Point R3 | 1.3577 |
[/s2If]
Download Nehcap EAWe have two EAs that are operational on our LIVE accounts.
- EA-FIX: Check out the details here. Download EA-FIX . EA-FIX is a non-grid HFT scalper.
- EA-GROWTH: High quality low dd EA using trend grids. Download EA_GROWTHJoin Our Telegram Group


