The Japanese authorities’ hesitations with regard to intervention prevented bullish investors from participating in the market at the EURJPY exchange rate of 156.985.
…
This is a premium post.
[s2If !current_user_can(access_s2member_level4)]Please register for FREE REGISTER to read full post below containing analysis. In case of any error or you think you are not able to read the full post below, please email us at support#nehcap.com [lwa][/s2If] [s2If current_user_can(access_s2member_level1)]
- Intervention hesitations by Japanese authorities refrained EUR/JPY bulls from entering the market.
The pair currently trades last at 156.985.
The previous day high was 157.93 while the previous day low was 157.32. The daily 38.2% Fib levels comes at 157.55, expected to provide resistance. Similarly, the daily 61.8% fib level is at 157.69, expected to provide resistance.
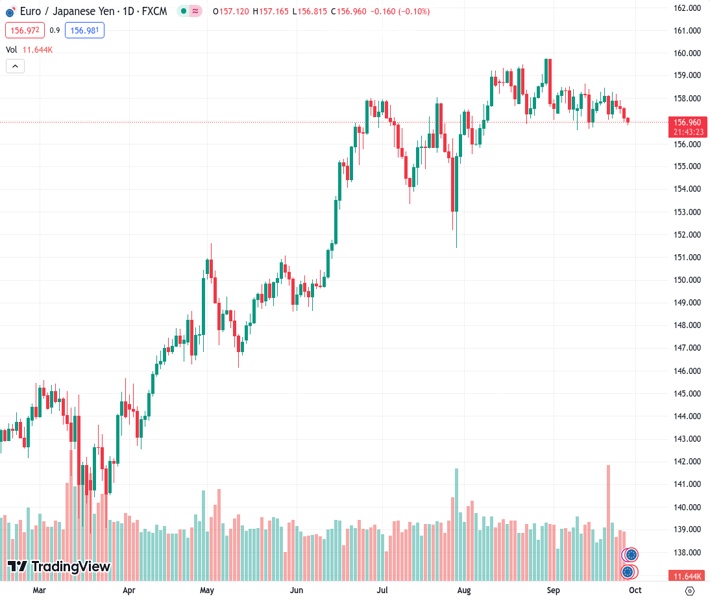
The EUR/JPY dropped towards the top of the Ichimoku Cloud (Kumo) at around 156.80 but jumped off that level and reclaimed the 157.00 figure as the Asian session began. The EUR/JPY prints minuscule losses of 0.06%, exchanging hands at around 157.02.
The daily chart shows the pair is extending its consolidation, but it briefly broke below a two-week low support trendline, which exacerbated a fall beneath 157.00. However, key support levels keep the EUR/JPY underpinned for higher prices. Still, threats of Japanese intervention in the Forex markets refrain bulls from opening fresh bets and break to a new cycle high, above the September 13 daily high at 158.65. Conversely, if EUR/JPY slips inside the Kumo, the first support would be the Senkou-Span B at 155.58, followed by the bottom of the Kumo at 155.20.
From an intraday perspective, the EUR/JPY hourly chart showed the pair is set to extend its losses, but it remains near yesterday’s lows. A breach of the lows at 156.95 could pave the way to test the September 15 swing low at 156.72, followed by the September 14 daily low of 156.64. Once those levels are cleared, the next stop would be 156.00.
Technical Levels: Supports and Resistances
EURJPY currently trading at 157.0 at the time of writing. Pair opened at 157.6 and is trading with a change of -0.38 % .
| Overview | Overview.1 | |
|---|---|---|
| 0 | Today last price | 157.00 |
| 1 | Today Daily Change | -0.60 |
| 2 | Today Daily Change % | -0.38 |
| 3 | Today daily open | 157.60 |
The pair is trading below its 20 Daily moving average @ 157.94, below its 50 Daily moving average @ 157.57 , above its 100 Daily moving average @ 155.1 and above its 200 Daily moving average @ 149.22
| Trends | Trends.1 | |
|---|---|---|
| 0 | Daily SMA20 | 157.94 |
| 1 | Daily SMA50 | 157.57 |
| 2 | Daily SMA100 | 155.10 |
| 3 | Daily SMA200 | 149.22 |
The previous day high was 157.93 while the previous day low was 157.32. The daily 38.2% Fib levels comes at 157.55, expected to provide resistance. Similarly, the daily 61.8% fib level is at 157.69, expected to provide resistance.
Note the levels of interest below:
- Pivot support is noted at 157.3, 157.01, 156.7
- Pivot resistance is noted at 157.91, 158.22, 158.51
| Levels | Levels.1 |
|---|---|
| Previous Daily High | 157.93 |
| Previous Daily Low | 157.32 |
| Previous Weekly High | 158.45 |
| Previous Weekly Low | 157.04 |
| Previous Monthly High | 159.76 |
| Previous Monthly Low | 155.53 |
| Daily Fibonacci 38.2% | 157.55 |
| Daily Fibonacci 61.8% | 157.69 |
| Daily Pivot Point S1 | 157.30 |
| Daily Pivot Point S2 | 157.01 |
| Daily Pivot Point S3 | 156.70 |
| Daily Pivot Point R1 | 157.91 |
| Daily Pivot Point R2 | 158.22 |
| Daily Pivot Point R3 | 158.51 |
[/s2If]
Download Nehcap EAWe have two EAs that are operational on our LIVE accounts.
- EA-FIX: Check out the details here. Download EA-FIX . EA-FIX is a non-grid HFT scalper.
- EA-GROWTH: High quality low dd EA using trend grids. Download EA_GROWTHJoin Our Telegram Group


