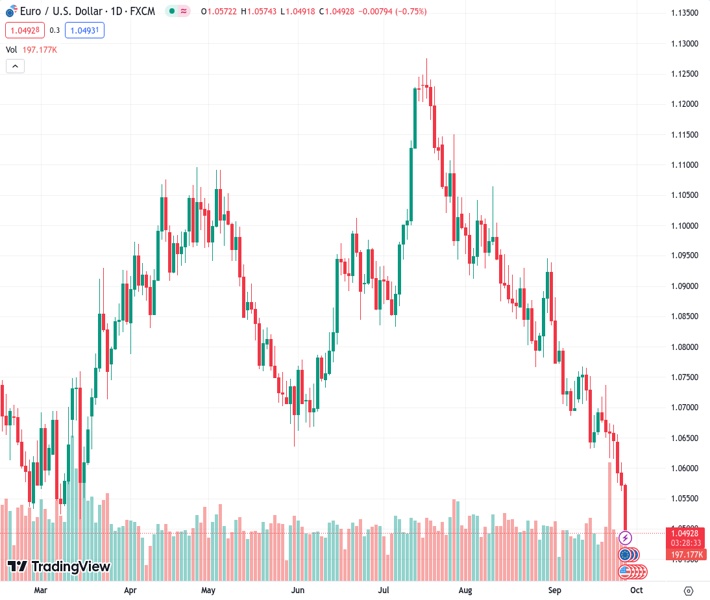
The EURUSD currency pair drops significantly to its lowest point in ten months, and those who are selling the pair are aiming for a low of 1.0482 that has not been seen so far this year.
…
This is a premium post.
[s2If !current_user_can(access_s2member_level4)]Please register for FREE REGISTER to read full post below containing analysis. In case of any error or you think you are not able to read the full post below, please email us at support#nehcap.com [lwa][/s2If] [s2If current_user_can(access_s2member_level1)]
- EUR/USD plummets to tenth-month lows, with sellers eyeing a YTD low 1.0482.
The pair currently trades last at 1.04942.
The previous day high was 1.0609 while the previous day low was 1.0562. The daily 38.2% Fib levels comes at 1.058, expected to provide resistance. Similarly, the daily 61.8% fib level is at 1.0591, expected to provide resistance.
The EUR/USD is tanking below 1.0500 after hitting a daily high of 1.0574 as US Treasury bond yields continued to climb while market sentiment deteriorated, as Wall Street registers losses between 0.45% and 0.60%.
Fears of a potential government shutdown in the United States (US) in four days would likely delay the release of critical economic data needed in difficult times of high inflation and economic uncertainty. That, alongside expectations of further tightening by the US Federal Reserve, sparked a rise in US Treasury bond yields to yearly highs, with the 10-year benchmark note about to pierce the 4.60% mark. As aforementioned, US equities continued to drop further.
A rise in US Durable Goods Orders showed a robust economy in the US and gave a leg-up to the US Dollar, as demonstrated by the US Dollar Index (DXY), with buyers eyeing the next resistance area at 107.19, the November 30, 2022, high.
Bearish sentiment in the Euro extended due to Consumer confidence in Germany, deteriorating further despite European Central Bank (ECB) members’ hawkish rhetoric, which failed to propel the EUR/USD higher.
Technical Levels: Supports and Resistances
EURUSD currently trading at 1.0501 at the time of writing. Pair opened at 1.0573 and is trading with a change of -0.68 % .
| Overview | Overview.1 | |
|---|---|---|
| 0 | Today last price | 1.0501 |
| 1 | Today Daily Change | -0.0072 |
| 2 | Today Daily Change % | -0.6800 |
| 3 | Today daily open | 1.0573 |
The pair remains strongly bearish on the daily time frame. It trades below the 20 SMA @ 1.0711, 50 SMA 1.0859, 100 SMA @ 1.0869 and 200 SMA @ 1.083.
| Trends | Trends.1 | |
|---|---|---|
| 0 | Daily SMA20 | 1.0711 |
| 1 | Daily SMA50 | 1.0859 |
| 2 | Daily SMA100 | 1.0869 |
| 3 | Daily SMA200 | 1.0830 |
The previous day high was 1.0609 while the previous day low was 1.0562. The daily 38.2% Fib levels comes at 1.058, expected to provide resistance. Similarly, the daily 61.8% fib level is at 1.0591, expected to provide resistance.
Note the levels of interest below:
- Pivot support is noted at 1.0554, 1.0534, 1.0507
- Pivot resistance is noted at 1.0601, 1.0628, 1.0648
| Levels | Levels.1 |
|---|---|
| Previous Daily High | 1.0609 |
| Previous Daily Low | 1.0562 |
| Previous Weekly High | 1.0737 |
| Previous Weekly Low | 1.0615 |
| Previous Monthly High | 1.1065 |
| Previous Monthly Low | 1.0766 |
| Daily Fibonacci 38.2% | 1.0580 |
| Daily Fibonacci 61.8% | 1.0591 |
| Daily Pivot Point S1 | 1.0554 |
| Daily Pivot Point S2 | 1.0534 |
| Daily Pivot Point S3 | 1.0507 |
| Daily Pivot Point R1 | 1.0601 |
| Daily Pivot Point R2 | 1.0628 |
| Daily Pivot Point R3 | 1.0648 |
[/s2If]
Download Nehcap EAWe have two EAs that are operational on our LIVE accounts.
- EA-FIX: Check out the details here. Download EA-FIX . EA-FIX is a non-grid HFT scalper.
- EA-GROWTH: High quality low dd EA using trend grids. Download EA_GROWTHJoin Our Telegram Group


