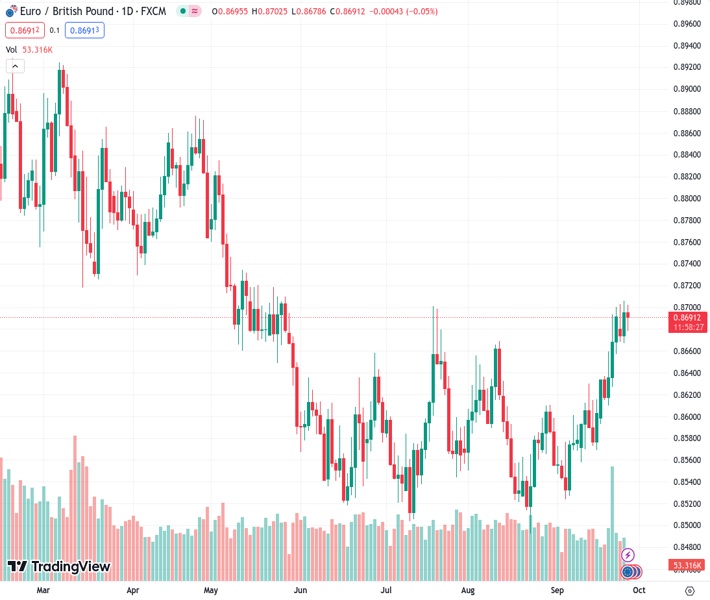
The EURGBP pair, currently trading at 0.86915, continues to stay lower than 0.8700 and the 200-day Simple Moving Average (SMA) during the initial part of the European session.
…
This is a premium post.
[s2If !current_user_can(access_s2member_level4)]Please register for FREE REGISTER to read full post below containing analysis. In case of any error or you think you are not able to read the full post below, please email us at support#nehcap.com [lwa][/s2If] [s2If current_user_can(access_s2member_level1)]
- EUR/GBP remains below 0.8700 and the 200-day SMA through the first half of the European session.
The pair currently trades last at 0.86915.
The previous day high was 0.8706 while the previous day low was 0.8668. The daily 38.2% Fib levels comes at 0.8692, expected to provide resistance. Similarly, the daily 61.8% fib level is at 0.8683, expected to provide support.
The EUR/GBP cross continues with its struggle to find acceptance above the 0.8700 mark on Wednesday and retreats a few pips from the vicinity of the highest level since July 20 touched the previous day. The fundamental backdrop, meanwhile, suggests that the path of least resistance for spot prices is to the upside, though bulls might still wait for a move beyond a technically significant 200-day Simple Moving Average (SMA) before placing fresh bets.
The British Pound (GBP) continues to be undermined by the Bank of England’s (BoE) surprise pause, which, in turn, is seen as a key factor acting as a tailwind for the EUR/GBP cross. The UK central bank ended a run of 14 straight interest rate hikes in the wake of the recent deceleration of inflation, signs that the UK labour market is cooling and reviving recession fears. The BoE’s Monetary Policy Committee voted 5-4 in favour of maintaining the main policy rate at a 15-year high level of 5.25%.
The European Central Bank President Christine Lagarde, meanwhile, said on Monday that interest rates will be set at sufficiently restrictive levels for as long as necessary. Furthermore, ECB board member Frank Eldersonm, in an interview with Market News International, noted that interest rates could still go higher, if necessary. This downplays the view that the next move is likely to be a rate cut, which contributes to the shared currency’s relative outperformance and lends support to the EUR/GBP cross.
That said, worries about a deep economic contraction in the Eurozone suggest that further hikes may be off the table for now. The fears were further fueled by the disappointing release of the forward-looking German GfK Consumer Climate Index, which fell to -26.5 in September from the previous month’s downwardly revised reading of -25.6. This indicates that the confidence in the Eurozone’s largest economy remains fragile and that the ECB’s
14-month-long tightening cycle could have reached its peak.
This is holding back traders from placing fresh bullish bets around the EUR/GBP cross and capping the upside. Hence, it will be prudent to wait for a sustained strength beyond a technically significant 200-day SMA before positioning for an extension of the recent upward trajectory witnessed over the past month or so.
Technical Levels: Supports and Resistances
EURGBP currently trading at 0.8691 at the time of writing. Pair opened at 0.8696 and is trading with a change of -0.06 % .
| Overview | Overview.1 | |
|---|---|---|
| 0 | Today last price | 0.8691 |
| 1 | Today Daily Change | -0.0005 |
| 2 | Today Daily Change % | -0.0600 |
| 3 | Today daily open | 0.8696 |
The pair is trading above its 20 Daily moving average @ 0.8606, above its 50 Daily moving average @ 0.8598 , above its 100 Daily moving average @ 0.8604 and below its 200 Daily moving average @ 0.8712
| Trends | Trends.1 | |
|---|---|---|
| 0 | Daily SMA20 | 0.8606 |
| 1 | Daily SMA50 | 0.8598 |
| 2 | Daily SMA100 | 0.8604 |
| 3 | Daily SMA200 | 0.8712 |
The previous day high was 0.8706 while the previous day low was 0.8668. The daily 38.2% Fib levels comes at 0.8692, expected to provide resistance. Similarly, the daily 61.8% fib level is at 0.8683, expected to provide support.
Note the levels of interest below:
- Pivot support is noted at 0.8674, 0.8652, 0.8636
- Pivot resistance is noted at 0.8712, 0.8728, 0.875
| Levels | Levels.1 |
|---|---|
| Previous Daily High | 0.8706 |
| Previous Daily Low | 0.8668 |
| Previous Weekly High | 0.8700 |
| Previous Weekly Low | 0.8599 |
| Previous Monthly High | 0.8669 |
| Previous Monthly Low | 0.8493 |
| Daily Fibonacci 38.2% | 0.8692 |
| Daily Fibonacci 61.8% | 0.8683 |
| Daily Pivot Point S1 | 0.8674 |
| Daily Pivot Point S2 | 0.8652 |
| Daily Pivot Point S3 | 0.8636 |
| Daily Pivot Point R1 | 0.8712 |
| Daily Pivot Point R2 | 0.8728 |
| Daily Pivot Point R3 | 0.8750 |
[/s2If]
Download Nehcap EAWe have two EAs that are operational on our LIVE accounts.
- EA-FIX: Check out the details here. Download EA-FIX . EA-FIX is a non-grid HFT scalper.
- EA-GROWTH: High quality low dd EA using trend grids. Download EA_GROWTHJoin Our Telegram Group


