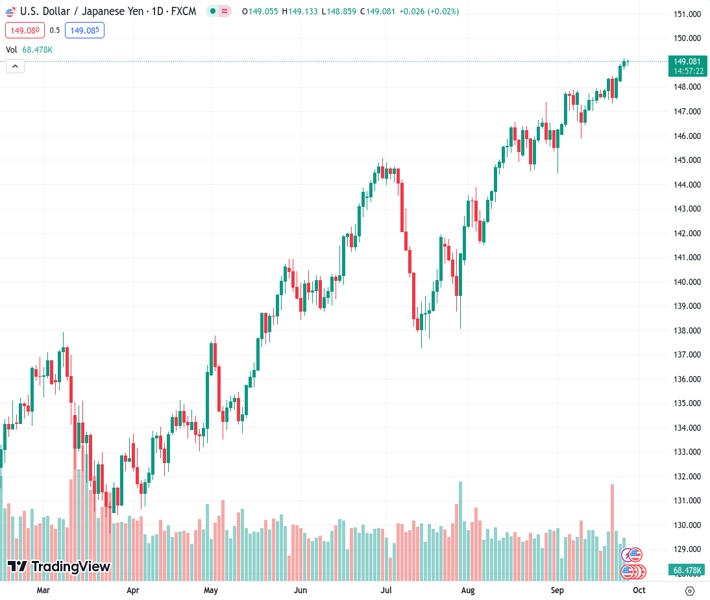
The USDJPY currency pair is receiving positive support at a price of 149.078 as a result of the economic information coming from the United States.
…
This is a premium post.
[s2If !current_user_can(access_s2member_level4)]Please register for FREE REGISTER to read full post below containing analysis. In case of any error or you think you are not able to read the full post below, please email us at support#nehcap.com [lwa][/s2If] [s2If current_user_can(access_s2member_level1)]
- USD/JPY experiences upward support due to the US economic data.
The pair currently trades last at 149.078.
The previous day high was 149.19 while the previous day low was 148.71. The daily 38.2% Fib levels comes at 149.0, expected to provide support. Similarly, the daily 61.8% fib level is at 148.89, expected to provide support.
USD/JPY hovers slightly below the high since November, trading around 149.10 psychological level during the Asian session on Wednesday. Market caution is bolstering the US Treasury yields, which supports the US Dollar (USD) against the Japanese Yen (JPY).
Bank of Japan (BoJ) policy meeting minutes showed that policymakers were in favor of maintaining current monetary easing to hit the price target, while several members emphasized the downside risks to Japan’s economy.
The upward momentum is potentially bullish as the 14-day Relative Strength Index (RSI) continues to stay above the 50 level. The psychological level at 150.00 could act as resistance.
A firm break above that level could inspire the USD/JPY bulls to explore the area around October’s high at 151.94 level.
On the downside, The USD/JPY pair could meet key support around the 148.00 psychological level lined up with a 14-day Exponential Moving Average (EMA) at 148.01.
If the USD/JPY pair collapses below the latter, the bears could navigate the region around the psychological level at 147.00, following the 23.6% Fibonacci retracement at 146.36.
The Moving Average Convergence Divergence (MACD) line remains above the centerline and the signal line. This setup indicates that the momentum in the USD/JPY’s price is potentially strong, suggesting bullish sentiment.
Technical Levels: Supports and Resistances
USDJPY currently trading at 149.08 at the time of writing. Pair opened at 149.06 and is trading with a change of 0.01 % .
| Overview | Overview.1 | |
|---|---|---|
| 0 | Today last price | 149.08 |
| 1 | Today Daily Change | 0.02 |
| 2 | Today Daily Change % | 0.01 |
| 3 | Today daily open | 149.06 |
The pair remains strongly bullish on the daily timeframe. It trades above its 20 SMA @ 147.46, 50 SMA 145.14, 100 SMA @ 142.72 and 200 SMA @ 137.78.
| Trends | Trends.1 | |
|---|---|---|
| 0 | Daily SMA20 | 147.46 |
| 1 | Daily SMA50 | 145.14 |
| 2 | Daily SMA100 | 142.72 |
| 3 | Daily SMA200 | 137.78 |
The previous day high was 149.19 while the previous day low was 148.71. The daily 38.2% Fib levels comes at 149.0, expected to provide support. Similarly, the daily 61.8% fib level is at 148.89, expected to provide support.
Note the levels of interest below:
- Pivot support is noted at 148.78, 148.5, 148.3
- Pivot resistance is noted at 149.26, 149.47, 149.75
| Levels | Levels.1 |
|---|---|
| Previous Daily High | 149.19 |
| Previous Daily Low | 148.71 |
| Previous Weekly High | 148.46 |
| Previous Weekly Low | 147.32 |
| Previous Monthly High | 147.38 |
| Previous Monthly Low | 141.51 |
| Daily Fibonacci 38.2% | 149.00 |
| Daily Fibonacci 61.8% | 148.89 |
| Daily Pivot Point S1 | 148.78 |
| Daily Pivot Point S2 | 148.50 |
| Daily Pivot Point S3 | 148.30 |
| Daily Pivot Point R1 | 149.26 |
| Daily Pivot Point R2 | 149.47 |
| Daily Pivot Point R3 | 149.75 |
[/s2If]
Download Nehcap EAWe have two EAs that are operational on our LIVE accounts.
- EA-FIX: Check out the details here. Download EA-FIX . EA-FIX is a non-grid HFT scalper.
- EA-GROWTH: High quality low dd EA using trend grids. Download EA_GROWTHJoin Our Telegram Group


