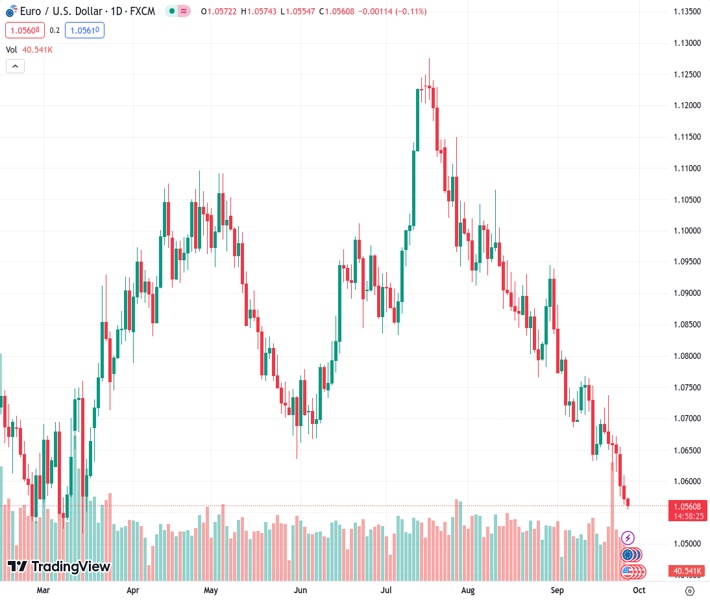
The EURUSD currency pair declines from its position above the mid-1.0500s and remains below the 50- and 100-hour Exponential Moving Averages (EMAs).
…
This is a premium post.
[s2If !current_user_can(access_s2member_level4)]Please register for FREE REGISTER to read full post below containing analysis. In case of any error or you think you are not able to read the full post below, please email us at support#nehcap.com [lwa][/s2If] [s2If current_user_can(access_s2member_level1)]
- EUR/USD loses traction above the mid-1.0500s; holds below the 50- and 100-hour EMAs.
The pair currently trades last at 1.05616.
The previous day high was 1.0609 while the previous day low was 1.0562. The daily 38.2% Fib levels comes at 1.058, expected to provide resistance. Similarly, the daily 61.8% fib level is at 1.0591, expected to provide resistance.
The EUR/USD pair remains under selling pressure for the seventh consecutive day during the early European session on Wednesday. The pair posts its lowest level since March 16 due to the hawkish stance from the Federal Reserve (Fed) and a sign that the European Central Bank (ECB) could avoid any further rate hikes. The major pair currently trades around 1.0563, losing 0.09% for the day.
According to the four-hour chart, EUR/USD holds below the 50- and 100-hour Exponential Moving Averages (EMAs) with a downward slope, which means the path of least resistance for the pair is to the downside. The Relative Strength Index (RSI) holds in bearish territory below 50. However, the oversold condition indicates that further consolidation cannot be ruled out before positioning for any near-term EUR/USD depreciation.
That said, the immediate resistance level for EUR/USD will emerge near a psychological round mark at 1.0600. The additional upside filter is located at 1.0640 (50-hour EMA). The critical barrier to watch is the 1.0675-1.0685 region, representing the confluence of the upper boundary of the Bollinger Band and the 100-hour EMA.
On the downside, the lower limit of the Bollinger Band at 1.0540 acts as a key support level for EUR/USD. Further south, the next stop of the major pair is seen at 1.0515 (a low of March 15). Any follow-through selling below the latter would expose the next downside stop at 1.0460 (a low of December 6, 2022)
Technical Levels: Supports and Resistances
EURUSD currently trading at 1.0563 at the time of writing. Pair opened at 1.0573 and is trading with a change of -0.09 % .
| Overview | Overview.1 | |
|---|---|---|
| 0 | Today last price | 1.0563 |
| 1 | Today Daily Change | -0.0010 |
| 2 | Today Daily Change % | -0.0900 |
| 3 | Today daily open | 1.0573 |
The pair remains strongly bearish on the daily time frame. It trades below the 20 SMA @ 1.0711, 50 SMA 1.0859, 100 SMA @ 1.0869 and 200 SMA @ 1.083.
| Trends | Trends.1 | |
|---|---|---|
| 0 | Daily SMA20 | 1.0711 |
| 1 | Daily SMA50 | 1.0859 |
| 2 | Daily SMA100 | 1.0869 |
| 3 | Daily SMA200 | 1.0830 |
The previous day high was 1.0609 while the previous day low was 1.0562. The daily 38.2% Fib levels comes at 1.058, expected to provide resistance. Similarly, the daily 61.8% fib level is at 1.0591, expected to provide resistance.
Note the levels of interest below:
- Pivot support is noted at 1.0554, 1.0534, 1.0507
- Pivot resistance is noted at 1.0601, 1.0628, 1.0648
| Levels | Levels.1 |
|---|---|
| Previous Daily High | 1.0609 |
| Previous Daily Low | 1.0562 |
| Previous Weekly High | 1.0737 |
| Previous Weekly Low | 1.0615 |
| Previous Monthly High | 1.1065 |
| Previous Monthly Low | 1.0766 |
| Daily Fibonacci 38.2% | 1.0580 |
| Daily Fibonacci 61.8% | 1.0591 |
| Daily Pivot Point S1 | 1.0554 |
| Daily Pivot Point S2 | 1.0534 |
| Daily Pivot Point S3 | 1.0507 |
| Daily Pivot Point R1 | 1.0601 |
| Daily Pivot Point R2 | 1.0628 |
| Daily Pivot Point R3 | 1.0648 |
[/s2If]
Download Nehcap EAWe have two EAs that are operational on our LIVE accounts.
- EA-FIX: Check out the details here. Download EA-FIX . EA-FIX is a non-grid HFT scalper.
- EA-GROWTH: High quality low dd EA using trend grids. Download EA_GROWTHJoin Our Telegram Group


