The USDCNH is staying close to 7.3125 after the release of Chinese data.
…
This is a premium post.
[s2If !current_user_can(access_s2member_level4)]Please register for FREE REGISTER to read full post below containing analysis. In case of any error or you think you are not able to read the full post below, please email us at support#nehcap.com [lwa][/s2If] [s2If current_user_can(access_s2member_level1)]
- USD/CNH hovers around 7.3125 following the Chinese data.
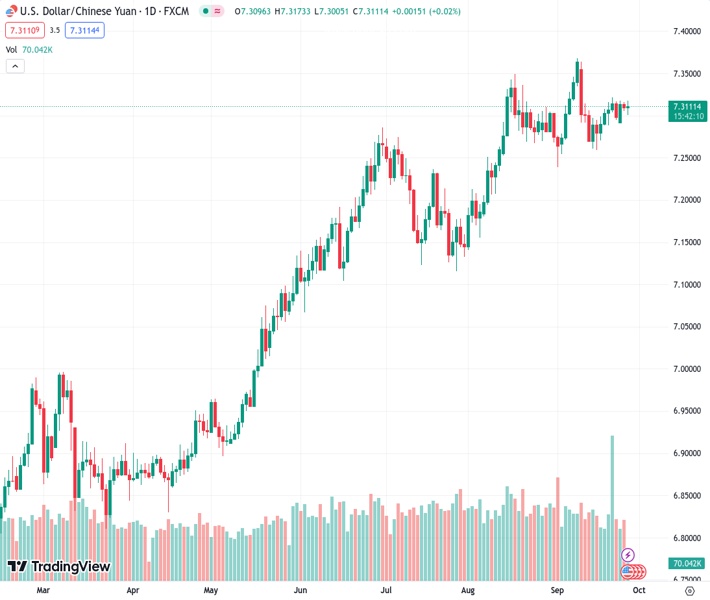
The pair currently trades last at 7.31191.
The previous day high was 7.3172 while the previous day low was 7.3058. The daily 38.2% Fib levels comes at 7.3101, expected to provide support. Similarly, the daily 61.8% fib level is at 7.3129, expected to provide resistance.
The USD/CNH pair posts modest gains around 7.3125 during the Asian session on Wednesday. The higher-for-longer rate narrative in the US may undermine risk sentiments and lift the Greenback against its rivals. Market players await the highly-anticipated US Core Personal Consumption Expenditure (PCE) Price Index data on Friday for fresh impetus. The annual figure is expected to decline from 4.2% to 3.9%.
The Federal Reserve (Fed) decided to hold interest rate unchanged in the 5.25% to 5.50% range in its September meeting last week. Apart from this, Fed officials still expect further rate rises later this year. Minneapolis Federal Reserve Bank President, Neel Kashkari stated on Tuesday that he is one of the Fed policymakers who sees one more rate hike this year. He added that US rates probably have to go a little bit higher and be held there for longer, to cool things off. The hawkish stance from the Federal Reserve (Fed) boosts the USD against the CNH.
About the data, economic data on Tuesday revealed that US Conference Board (CB) Consumer Confidence rose to 103.0 in September from 108.7 in August. The figures reached their lowest level in four months, reflecting the impact of rising interest rates and political uncertainty. In August, Building Permits came in at 1.541M from the previous month’s figure of 1.44M. The House Price Index for July increased to 0.8% MoM from 0.4% in the prior reading, exceeding the consensus estimate of 0.5%. August New Home Sales decreased -8.7% from July’s rise of 8%.
On the other hand, data released by the National Bureau of Statistics (NBS) showed on Wednesday that China’s Industrial Profits rose by 17.2% from a year earlier. This figure reversed the trend after declining in the past five months. Furthermore, the People’s Bank of China (PBOC) stated on Wednesday that the central bank will step up policy adjustments and implement monetary policy in a precise and forceful manner in order to support the economy. Any evidence of China data improvement and PBoC warning could turn into a pullback in USD/CNH and act as a headwind for the pair.
Looking ahead, traders will take cues from the US Gross Domestic Product (GDP) Annualized for the second quarter on Thursday and the Core Personal Consumption Expenditure (PCE) Price Index will be released on Friday. These figures could give a clear direction to the USD/CNH pair.
Technical Levels: Supports and Resistances
USDCNH currently trading at 7.3112 at the time of writing. Pair opened at 7.3102 and is trading with a change of 0.01 % .
| Overview | Overview.1 | |
|---|---|---|
| 0 | Today last price | 7.3112 |
| 1 | Today Daily Change | 0.0010 |
| 2 | Today Daily Change % | 0.0100 |
| 3 | Today daily open | 7.3102 |
The pair remains strongly bullish on the daily timeframe. It trades above its 20 SMA @ 7.3021, 50 SMA 7.262, 100 SMA @ 7.1998 and 200 SMA @ 7.0366.
| Trends | Trends.1 | |
|---|---|---|
| 0 | Daily SMA20 | 7.3021 |
| 1 | Daily SMA50 | 7.2620 |
| 2 | Daily SMA100 | 7.1998 |
| 3 | Daily SMA200 | 7.0366 |
The previous day high was 7.3172 while the previous day low was 7.3058. The daily 38.2% Fib levels comes at 7.3101, expected to provide support. Similarly, the daily 61.8% fib level is at 7.3129, expected to provide resistance.
Note the levels of interest below:
- Pivot support is noted at 7.3048, 7.2995, 7.2933
- Pivot resistance is noted at 7.3163, 7.3225, 7.3278
| Levels | Levels.1 |
|---|---|
| Previous Daily High | 7.3172 |
| Previous Daily Low | 7.3058 |
| Previous Weekly High | 7.3216 |
| Previous Weekly Low | 7.2718 |
| Previous Monthly High | 7.3496 |
| Previous Monthly Low | 7.1452 |
| Daily Fibonacci 38.2% | 7.3101 |
| Daily Fibonacci 61.8% | 7.3129 |
| Daily Pivot Point S1 | 7.3048 |
| Daily Pivot Point S2 | 7.2995 |
| Daily Pivot Point S3 | 7.2933 |
| Daily Pivot Point R1 | 7.3163 |
| Daily Pivot Point R2 | 7.3225 |
| Daily Pivot Point R3 | 7.3278 |
[/s2If]
Download Nehcap EAWe have two EAs that are operational on our LIVE accounts.
- EA-FIX: Check out the details here. Download EA-FIX . EA-FIX is a non-grid HFT scalper.
- EA-GROWTH: High quality low dd EA using trend grids. Download EA_GROWTHJoin Our Telegram Group


