The NZDUSD pair is experiencing selling pressure as the US Dollar continues to rally.
…
This is a premium post.
[s2If !current_user_can(access_s2member_level4)]Please register for FREE REGISTER to read full post below containing analysis. In case of any error or you think you are not able to read the full post below, please email us at support#nehcap.com [lwa][/s2If] [s2If current_user_can(access_s2member_level1)]
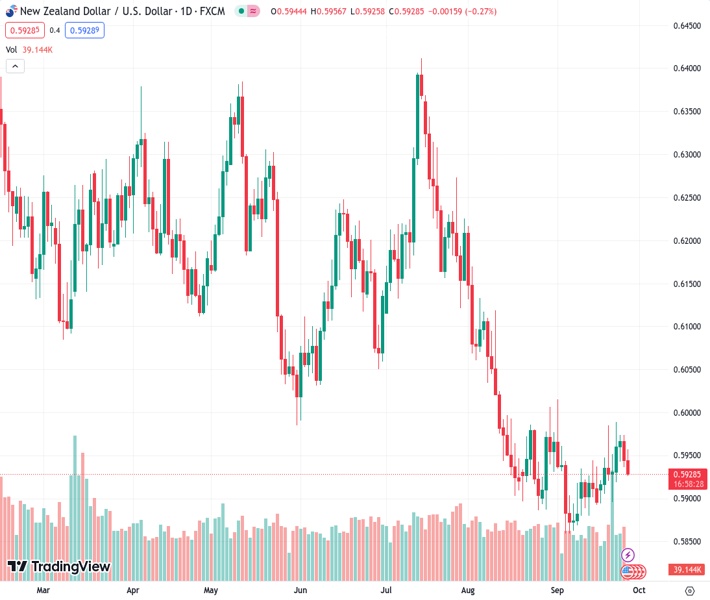
- NZD/USD remains under selling pressure amid a rally of the US Dollar.
The pair currently trades last at 0.59285.
The previous day high was 0.5974 while the previous day low was 0.5935. The daily 38.2% Fib levels comes at 0.595, expected to provide resistance. Similarly, the daily 61.8% fib level is at 0.5959, expected to provide resistance.
The NZD/USD pair trades in negative territory for two straight days during the Asian session on Wednesday. The uptick in the pair is bolstered by the stronger US Dollar (USD) and risk aversion. The pair currently trades near 0.5932, down 0.20% for the day.
Tuesday’s economic data revealed that US Conference Board (CB) Consumer Confidence rose to 103.0 in September from 108.7 in August. The figures reached their lowest level in four months, reflecting the impact of rising interest rates and political uncertainty. In August, Building Permits came in at 1.541M from the previous month’s figure of 1.44M. The House Price Index for July increased to 0.8% MoM from 0.4% in the prior reading, exceeding the consensus estimate of 0.5%. August New Home Sales decreased -8.7% from July’s rise of 8%.
The Federal Reserve (Fed) decided to hold interest rate unchanged in the 5.25% to 5.50% range in its September meeting last week. In terms of macroeconomic predictions, most members still expect further rate rises later this year. Minneapolis Federal Reserve Bank President, Neel Kashkari stated on Tuesday that he is one of the Fed policymakers who sees one more rate hike this year. He added that US rates probably have to go a little bit higher and be held there for longer, to cool things off. The hawkish stance from the Federal Reserve (Fed) boosts the USD against the New Zealand Dollar (NZD) and acts as a headwind for the NZD/USD pair.
On the Kiwi front, the markets appear to have priced in an Official Cash Rate (OCR) rate hike by the Reserve Bank of New Zealand (RBNZ) through the end of 2023 as the New Zealand economy indicates to be more resilient than initially expected. About the data last week, New Zealand’s Trade Balance (NZD) dropped to $-2,291M MoM in August versus $-1,107M prior. The annual trade deficit improved to $15.54B for the said month versus $-15.88B prior figures.
Looking ahead, New Zealand’s Business Confidence for September and ANZ Roy Morgan Consumer Confidence will be due on Thursday and Friday, respectively. On the US docket, the US Durable Goods Orders report will be released on Wednesday. The focus will shift to the Fed’s preferred measure of consumer inflation, the Core Personal Consumption Expenditure (PCE) Price Index, scheduled for release on Friday. It is anticipated that the annual rate will decline from 4.2% to 3.9%. Traders will take cues from the data to find AUD/USD trading opportunities.
Technical Levels: Supports and Resistances
NZDUSD currently trading at 0.5931 at the time of writing. Pair opened at 0.5945 and is trading with a change of -0.24 % .
| Overview | Overview.1 | |
|---|---|---|
| 0 | Today last price | 0.5931 |
| 1 | Today Daily Change | -0.0014 |
| 2 | Today Daily Change % | -0.2400 |
| 3 | Today daily open | 0.5945 |
The pair is trading above its 20 Daily moving average @ 0.5923, below its 50 Daily moving average @ 0.6004 , below its 100 Daily moving average @ 0.6089 and below its 200 Daily moving average @ 0.6184
| Trends | Trends.1 | |
|---|---|---|
| 0 | Daily SMA20 | 0.5923 |
| 1 | Daily SMA50 | 0.6004 |
| 2 | Daily SMA100 | 0.6089 |
| 3 | Daily SMA200 | 0.6184 |
The previous day high was 0.5974 while the previous day low was 0.5935. The daily 38.2% Fib levels comes at 0.595, expected to provide resistance. Similarly, the daily 61.8% fib level is at 0.5959, expected to provide resistance.
Note the levels of interest below:
- Pivot support is noted at 0.5929, 0.5912, 0.589
- Pivot resistance is noted at 0.5968, 0.599, 0.6007
| Levels | Levels.1 |
|---|---|
| Previous Daily High | 0.5974 |
| Previous Daily Low | 0.5935 |
| Previous Weekly High | 0.5990 |
| Previous Weekly Low | 0.5894 |
| Previous Monthly High | 0.6219 |
| Previous Monthly Low | 0.5885 |
| Daily Fibonacci 38.2% | 0.5950 |
| Daily Fibonacci 61.8% | 0.5959 |
| Daily Pivot Point S1 | 0.5929 |
| Daily Pivot Point S2 | 0.5912 |
| Daily Pivot Point S3 | 0.5890 |
| Daily Pivot Point R1 | 0.5968 |
| Daily Pivot Point R2 | 0.5990 |
| Daily Pivot Point R3 | 0.6007 |
[/s2If]
Download Nehcap EAWe have two EAs that are operational on our LIVE accounts.
- EA-FIX: Check out the details here. Download EA-FIX . EA-FIX is a non-grid HFT scalper.
- EA-GROWTH: High quality low dd EA using trend grids. Download EA_GROWTHJoin Our Telegram Group


