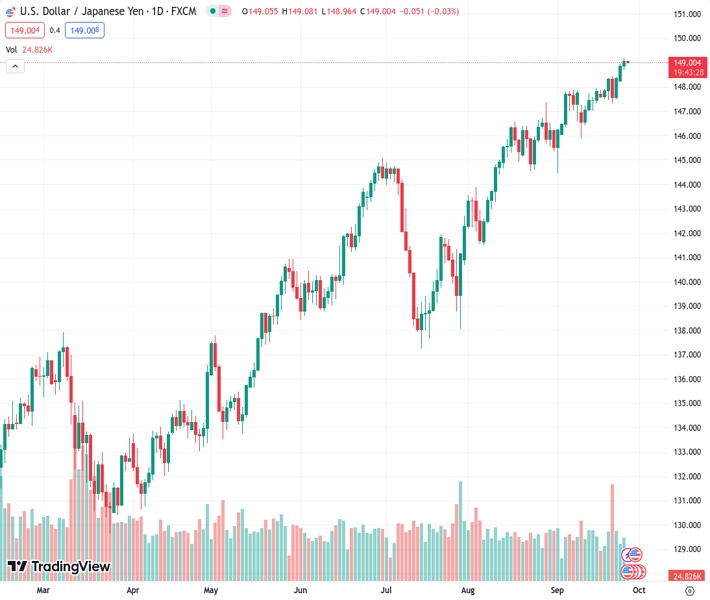
The USDJPY pair at 149.013 is observed to be consolidating the gains it recently made, reaching the highest level since October 2022.
…
This is a premium post.
[s2If !current_user_can(access_s2member_level4)]Please register for FREE REGISTER to read full post below containing analysis. In case of any error or you think you are not able to read the full post below, please email us at support#nehcap.com [lwa][/s2If] [s2If current_user_can(access_s2member_level1)]
- USD/JPY is seen consolidating its recent gains to the highest level since October 2022.
The pair currently trades last at 149.013.
The previous day high was 149.19 while the previous day low was 148.71. The daily 38.2% Fib levels comes at 149.0, expected to provide support. Similarly, the daily 61.8% fib level is at 148.89, expected to provide support.
The USD/JPY pair struggles to gain any meaningful traction on Wednesday and oscillates in a narrow trading band through the Asian session. Spot prices currently hover around the 149.00 mark, just below the highest level since October 2022 touched on Tuesday and move little in reaction to the Bank of Japan (BoJ) policy meeting minutes.
Policymakers agreed that the BoJ must maintain current monetary easing to stably, and sustainably hit the price target, while several members noted the downside risks to Japan’s economy, prices were big mainly regarding the impact of overseas developments. This comes on top of BoJ Governor Kazuo Ueda’s remarks earlier this week, reaffirming that the central bank is more likely to stick to its ultra-loose monetary policy stance in the near future. In contrast, the Federal Reserve (Fed) signalled the possibility of at least one more rate hike by the end of this year, which allows the US Dollar (USD) to stand tall near the YTD peak and acts as a tailwind for the USD/JPY pair.
In fact, the US central bank last week reiterated that interest rates will remain higher for longer in the wake of sticky inflation in the US. Furthermore, investors are now getting increasingly wary about the potential inflationary impact of rising Oil prices. Adding to this, the incoming resilient US macro data supports prospects for further policy tightening by the Fed. The hawkish outlook, meanwhile, remains supportive of elevated US Treasury bond yields, which continue to underpin the Greenback and the USD/JPY pair. However, speculations that Japanese authorities will intervene in the foreign exchange market to support the domestic currency cap the upside.
Traders also seem reluctant to place aggressive bets and prefer to wait for Fed Chair Jerome Powell’s speech on Thursday. Apart from this, investors, this week will confront the release of important US macro data, including Durable Goods Orders later this Wednesday, the final Q2 GDP print on Thursday and the Core PCE Price Index on Friday. This, in turn, will play a key role in influencing the USD price dynamics and provide some meaningful impetus to the USD/JPY pair. The aforementioned fundamental backdrop, meanwhile, seems tilted firmly in favour of bullish traders and suggests that the path of least resistance for spot prices remains to the upside.
Technical Levels: Supports and Resistances
USDJPY currently trading at 149.04 at the time of writing. Pair opened at 149.06 and is trading with a change of -0.01 % .
| Overview | Overview.1 | |
|---|---|---|
| 0 | Today last price | 149.04 |
| 1 | Today Daily Change | -0.02 |
| 2 | Today Daily Change % | -0.01 |
| 3 | Today daily open | 149.06 |
The pair remains strongly bullish on the daily timeframe. It trades above its 20 SMA @ 147.46, 50 SMA 145.14, 100 SMA @ 142.72 and 200 SMA @ 137.78.
| Trends | Trends.1 | |
|---|---|---|
| 0 | Daily SMA20 | 147.46 |
| 1 | Daily SMA50 | 145.14 |
| 2 | Daily SMA100 | 142.72 |
| 3 | Daily SMA200 | 137.78 |
The previous day high was 149.19 while the previous day low was 148.71. The daily 38.2% Fib levels comes at 149.0, expected to provide support. Similarly, the daily 61.8% fib level is at 148.89, expected to provide support.
Note the levels of interest below:
- Pivot support is noted at 148.78, 148.5, 148.3
- Pivot resistance is noted at 149.26, 149.47, 149.75
| Levels | Levels.1 |
|---|---|
| Previous Daily High | 149.19 |
| Previous Daily Low | 148.71 |
| Previous Weekly High | 148.46 |
| Previous Weekly Low | 147.32 |
| Previous Monthly High | 147.38 |
| Previous Monthly Low | 141.51 |
| Daily Fibonacci 38.2% | 149.00 |
| Daily Fibonacci 61.8% | 148.89 |
| Daily Pivot Point S1 | 148.78 |
| Daily Pivot Point S2 | 148.50 |
| Daily Pivot Point S3 | 148.30 |
| Daily Pivot Point R1 | 149.26 |
| Daily Pivot Point R2 | 149.47 |
| Daily Pivot Point R3 | 149.75 |
[/s2If]
Download Nehcap EAWe have two EAs that are operational on our LIVE accounts.
- EA-FIX: Check out the details here. Download EA-FIX . EA-FIX is a non-grid HFT scalper.
- EA-GROWTH: High quality low dd EA using trend grids. Download EA_GROWTHJoin Our Telegram Group


