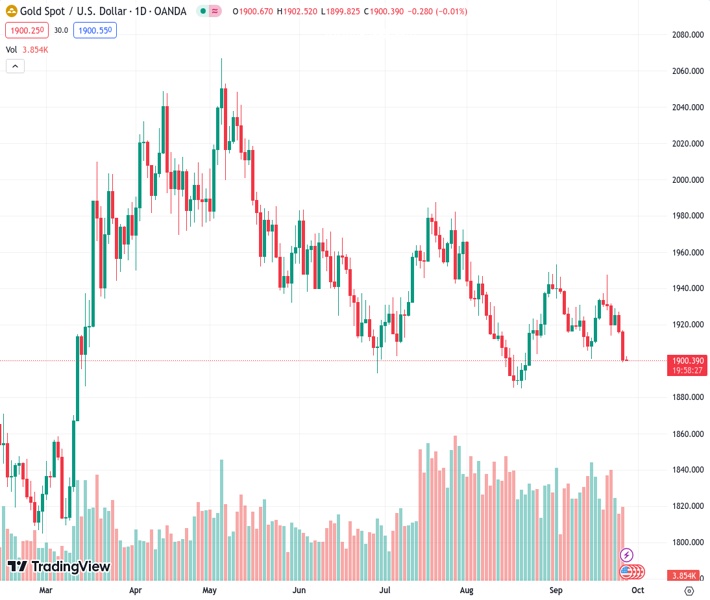
The gold price at 1,900.17 is experiencing a slowdown due to the increased strength of the US dollar.
…
This is a premium post.
[s2If !current_user_can(access_s2member_level4)]Please register for FREE REGISTER to read full post below containing analysis. In case of any error or you think you are not able to read the full post below, please email us at support#nehcap.com [lwa][/s2If] [s2If current_user_can(access_s2member_level1)]
- Gold price loses momentum amid the stronger USD.
The pair currently trades last at 1900.17.
The previous day high was 1916.87 while the previous day low was 1899.25. The daily 38.2% Fib levels comes at 1905.98, expected to provide resistance. Similarly, the daily 61.8% fib level is at 1910.14, expected to provide resistance.
Gold price (XAU/USD) attracts some sellers around $1,902 during the early European session on Wednesday. Precious Metal faces some selling pressure due to a rally of the US Dollar (USD) ahead of the highly-anticipated inflation data on Friday. Meanwhile, the US Dollar Index (DXY), a measure of the value of the USD relative to a basket of foreign currencies, has risen above 106.20, the highest level since November.
Economic data released on Tuesday showed that the US Conference Board (CB) Consumer Confidence for September rose by 103.0 from 108.7 in August. The figures dropped to a four-month low and indicated the impact of higher interest rates and concerns about the political environment. Meanwhile, the Building Permits came in at 1.541M in August from the previous reading of 1.443M. The House Price Index for July rose to 0.8% MoM from 0.4% in the previous reading, above the market consensus of 0.5%. New Home Sales declined -8.7% in August from 8% rise in July.
The Federal Reserve (Fed) decided to hold the interest rate unchanged in the 5.25% to 5.50% range last week. In terms of macroeconomic predictions, most members still expect further rate rises later this year. Minneapolis Federal Reserve Bank President, Neel Kashkari stated on Tuesday that he is one of the Fed policymakers who sees one more rate hike this year. He added that US rates probably have to go a little bit higher and be held there for longer, to cool things off. The hawkish comments from Fed officials boost the US Dollar (USD) across the board. It’s worth noting that rising interest rates raise the opportunity cost of investing in non-yielding assets, implying a negative outlook for XAU/USD.
Gold traders will keep an eye on the US Core Personal Consumption Expenditure (PCE) Price Index, the Fed’s preferred measure of consumer inflation on Friday. The annual figure is expected to drop from 4.2% to 3.9%. Traders will take cues from the data and find trading opportunities around gold price.
On the one-hour chart, gold price holds below the 50- and 100-hour Exponential Moving Averages (EMAs), which means the past of least resistance is to the downside. Meanwhile, the Relative Strength Index (RSI) is located in bearish territory below 50, activating the bearish momentum for gold price.
Resistance level: $1,917, $1,945 and $1,970
Support level: $1,895, $$1,865 and $1,830
Technical Levels: Supports and Resistances
XAUUSD currently trading at 1901.32 at the time of writing. Pair opened at 1901.0 and is trading with a change of 0.02 % .
| Overview | Overview.1 | |
|---|---|---|
| 0 | Today last price | 1901.32 |
| 1 | Today Daily Change | 0.32 |
| 2 | Today Daily Change % | 0.02 |
| 3 | Today daily open | 1901.00 |
The pair remains strongly bearish on the daily time frame. It trades below the 20 SMA @ 1923.92, 50 SMA 1927.69, 100 SMA @ 1939.88 and 200 SMA @ 1926.76.
| Trends | Trends.1 | |
|---|---|---|
| 0 | Daily SMA20 | 1923.92 |
| 1 | Daily SMA50 | 1927.69 |
| 2 | Daily SMA100 | 1939.88 |
| 3 | Daily SMA200 | 1926.76 |
The previous day high was 1916.87 while the previous day low was 1899.25. The daily 38.2% Fib levels comes at 1905.98, expected to provide resistance. Similarly, the daily 61.8% fib level is at 1910.14, expected to provide resistance.
Note the levels of interest below:
- Pivot support is noted at 1894.54, 1888.09, 1876.92
- Pivot resistance is noted at 1912.16, 1923.33, 1929.78
| Levels | Levels.1 |
|---|---|
| Previous Daily High | 1916.87 |
| Previous Daily Low | 1899.25 |
| Previous Weekly High | 1947.47 |
| Previous Weekly Low | 1913.95 |
| Previous Monthly High | 1966.08 |
| Previous Monthly Low | 1884.85 |
| Daily Fibonacci 38.2% | 1905.98 |
| Daily Fibonacci 61.8% | 1910.14 |
| Daily Pivot Point S1 | 1894.54 |
| Daily Pivot Point S2 | 1888.09 |
| Daily Pivot Point S3 | 1876.92 |
| Daily Pivot Point R1 | 1912.16 |
| Daily Pivot Point R2 | 1923.33 |
| Daily Pivot Point R3 | 1929.78 |
[/s2If]
Download Nehcap EAWe have two EAs that are operational on our LIVE accounts.
- EA-FIX: Check out the details here. Download EA-FIX . EA-FIX is a non-grid HFT scalper.
- EA-GROWTH: High quality low dd EA using trend grids. Download EA_GROWTHJoin Our Telegram Group


