Losses for the EURJPY currency pair at a rate of 157.574 were minimal due to the overall weakness of the Japanese Yen.
…
This is a premium post.
[s2If !current_user_can(access_s2member_level4)]Please register for FREE REGISTER to read full post below containing analysis. In case of any error or you think you are not able to read the full post below, please email us at support#nehcap.com [lwa][/s2If] [s2If current_user_can(access_s2member_level1)]
- EUR/JPY registered slim losses, capped by broad Japanese Yen weakness.
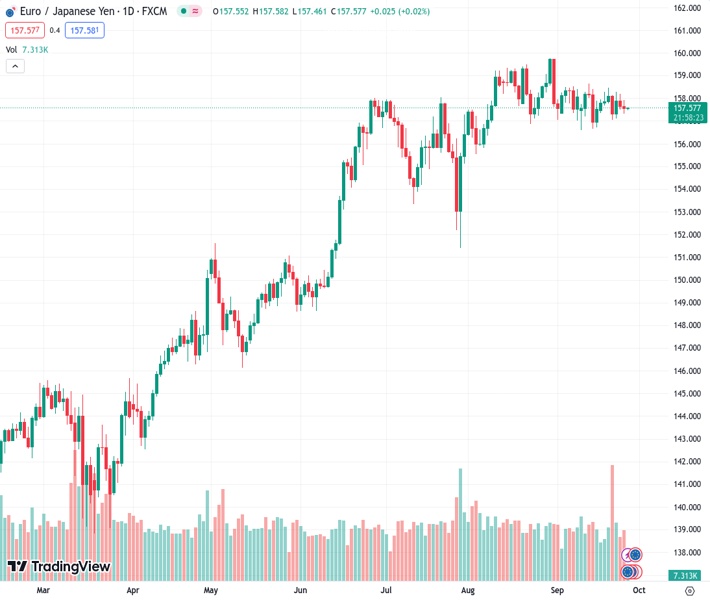
The pair currently trades last at 157.574.
The previous day high was 158.18 while the previous day low was 157.49. The daily 38.2% Fib levels comes at 157.75, expected to provide resistance. Similarly, the daily 61.8% fib level is at 157.91, expected to provide resistance.
EUR/JPY failed to gain traction past the 158.00 figure, instead retreated towards the 157.50s area, and recorded losses of 0.07% on Tuesday. As Wednesday’s Asian session begins, the cross-pair is trading at 157.57, almost unchanged.
From a daily chart perspective, the EUR/JPY is set to extend its losses but has failed to do so on overall Japanese Yen (JPY) weakness. Nevertheless, once the pair drops inside the Ichimoku Cloud (Kumo) at around 156.70, that would exacerbate the pair’s drop. Subsequent support would emerge at the Senkou Span B at 155.58, before slumping toward the July 28 low of 151.40.
The EUR/JPY hourly chart shows the pair is trading below key resistance levels, with the Tenkan-Sen at 157.55 and the bottom of the Kumo at around 157.60. If those areas are cleared, the next stop would be the September 26 daily high at 157.92. However, the path of least resistance is to the downside.
That said, the EUR/JPY first support would be the September 26 low at 157.31, followed by the 157.00 figure. The pair’s next floor level would be the September 15 daily low at 156.72, followed by the September 14 swing low at 156.63.
Technical Levels: Supports and Resistances
EURJPY currently trading at 157.58 at the time of writing. Pair opened at 157.72 and is trading with a change of -0.09 % .
| Overview | Overview.1 | |
|---|---|---|
| 0 | Today last price | 157.58 |
| 1 | Today Daily Change | -0.14 |
| 2 | Today Daily Change % | -0.09 |
| 3 | Today daily open | 157.72 |
The pair is trading below its 20 Daily moving average @ 158.0, above its 50 Daily moving average @ 157.54 , above its 100 Daily moving average @ 155.01 and above its 200 Daily moving average @ 149.13
| Trends | Trends.1 | |
|---|---|---|
| 0 | Daily SMA20 | 158.00 |
| 1 | Daily SMA50 | 157.54 |
| 2 | Daily SMA100 | 155.01 |
| 3 | Daily SMA200 | 149.13 |
The previous day high was 158.18 while the previous day low was 157.49. The daily 38.2% Fib levels comes at 157.75, expected to provide resistance. Similarly, the daily 61.8% fib level is at 157.91, expected to provide resistance.
Note the levels of interest below:
- Pivot support is noted at 157.41, 157.1, 156.72
- Pivot resistance is noted at 158.1, 158.49, 158.8
| Levels | Levels.1 |
|---|---|
| Previous Daily High | 158.18 |
| Previous Daily Low | 157.49 |
| Previous Weekly High | 158.45 |
| Previous Weekly Low | 157.04 |
| Previous Monthly High | 159.76 |
| Previous Monthly Low | 155.53 |
| Daily Fibonacci 38.2% | 157.75 |
| Daily Fibonacci 61.8% | 157.91 |
| Daily Pivot Point S1 | 157.41 |
| Daily Pivot Point S2 | 157.10 |
| Daily Pivot Point S3 | 156.72 |
| Daily Pivot Point R1 | 158.10 |
| Daily Pivot Point R2 | 158.49 |
| Daily Pivot Point R3 | 158.80 |
[/s2If]
Download Nehcap EAWe have two EAs that are operational on our LIVE accounts.
- EA-FIX: Check out the details here. Download EA-FIX . EA-FIX is a non-grid HFT scalper.
- EA-GROWTH: High quality low dd EA using trend grids. Download EA_GROWTHJoin Our Telegram Group


