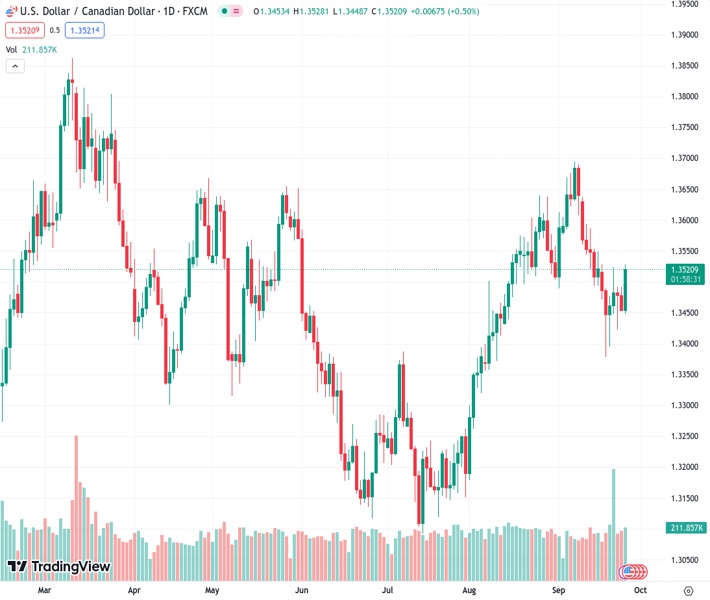
The USDCAD pair reached above the 1.3500 level during trading on Tuesday.
…
This is a premium post.
[s2If !current_user_can(access_s2member_level4)]Please register for FREE REGISTER to read full post below containing analysis. In case of any error or you think you are not able to read the full post below, please email us at support#nehcap.com [lwa][/s2If] [s2If current_user_can(access_s2member_level1)]
- The USD/CAD had cleared the 1.3500 handle in Tuesday trading.
The pair currently trades last at 1.35228.
The previous day high was 1.3492 while the previous day low was 1.3453. The daily 38.2% Fib levels comes at 1.3468, expected to provide support. Similarly, the daily 61.8% fib level is at 1.3477, expected to provide support.
The USD/CAD has decisively reclaimed the 1.3500 major handle for Tuesday. The US Dollar Index (DXY) is pumping higher across the entire market, bolstered by a hawkish Fed and risk aversion taking a bite out of the market’s appetite for riskier assets.
The broad US Dollar Index (DXY) is at its highest levels since last November, and the Greenback (USD) is taking a step higher. Even with oil prices rising for Tuesday which would normally prop up the Loonie (CAD), the USD is still the clear winner on the charts.
US Treasury yields are knocking on multi-year highs with the 10-year Treasury yield holding above 4.5%, pushing the USD higher. US markets are increasingly concerned about a potential US government shutdown looming, knocking risk appetite even further back.
On the data docket it’s notably CAD-thin, leaving investors to focus almost entirely on US data for this week.
Tuesday saw US Housing Price Index figures cleanly beat expectations, printing at 0.8%, leaping over the forecast 0.5% and doubling the previous reading of 0.4%.
Wednesday will bring US Durable Goods Orders (forecast: -0.5%, previous -5.2%), and investors will be focusing on US Gross Domestic Product (GDP) figures due on Thursday. Median market forecasts are anticipating a steady print at an annualized 2.1% for the second quarter.
The trading week will close out with US Personal Consumption Expenditure (PCE) Price Index data on Friday. PCE, the Federal Reserve’s (Fed) preferred US inflation measure, is expected to hold steady at 0.2% for the month of August.
A data beat could see the Greenback clear even further ground with Fed policymakers already leaning towards the potential for further rate hikes in the future if inflation refuses to bed down.
The Greenback is up 0.3% against the Loonie in Tuesday’s market session, vaulting the 1.3500 mark and poised to extend further beyond the 200-hour Simple Moving Average (SMA) currently chalked in near 1.3480.
Near-term resistance is coming from last week’s swing high near 1.3525, and intraday bullish momentum might find a covering pullback from here.
On the daily candlesticks, the USD/CAD is geared for a decisive split from the 200-day SMA, which has constrained price action for several days and is currently settling just north of 1.3450. An extended bull run will see the pair set for a re-challenge of early September’s peak of 1.3695.
Technical Levels: Supports and Resistances
USDCAD currently trading at 1.3524 at the time of writing. Pair opened at 1.3454 and is trading with a change of 0.52 % .
| Overview | Overview.1 | |
|---|---|---|
| 0 | Today last price | 1.3524 |
| 1 | Today Daily Change | 0.0070 |
| 2 | Today Daily Change % | 0.5200 |
| 3 | Today daily open | 1.3454 |
The pair is trading below its 20 Daily moving average @ 1.3545, above its 50 Daily moving average @ 1.3446 , above its 100 Daily moving average @ 1.34 and above its 200 Daily moving average @ 1.3461
| Trends | Trends.1 | |
|---|---|---|
| 0 | Daily SMA20 | 1.3545 |
| 1 | Daily SMA50 | 1.3446 |
| 2 | Daily SMA100 | 1.3400 |
| 3 | Daily SMA200 | 1.3461 |
The previous day high was 1.3492 while the previous day low was 1.3453. The daily 38.2% Fib levels comes at 1.3468, expected to provide support. Similarly, the daily 61.8% fib level is at 1.3477, expected to provide support.
Note the levels of interest below:
- Pivot support is noted at 1.3441, 1.3428, 1.3402
- Pivot resistance is noted at 1.3479, 1.3505, 1.3518
| Levels | Levels.1 |
|---|---|
| Previous Daily High | 1.3492 |
| Previous Daily Low | 1.3453 |
| Previous Weekly High | 1.3528 |
| Previous Weekly Low | 1.3379 |
| Previous Monthly High | 1.3640 |
| Previous Monthly Low | 1.3184 |
| Daily Fibonacci 38.2% | 1.3468 |
| Daily Fibonacci 61.8% | 1.3477 |
| Daily Pivot Point S1 | 1.3441 |
| Daily Pivot Point S2 | 1.3428 |
| Daily Pivot Point S3 | 1.3402 |
| Daily Pivot Point R1 | 1.3479 |
| Daily Pivot Point R2 | 1.3505 |
| Daily Pivot Point R3 | 1.3518 |
[/s2If]
Download Nehcap EAWe have two EAs that are operational on our LIVE accounts.
- EA-FIX: Check out the details here. Download EA-FIX . EA-FIX is a non-grid HFT scalper.
- EA-GROWTH: High quality low dd EA using trend grids. Download EA_GROWTHJoin Our Telegram Group


