The US dollar to Mexican peso exchange rate (USDMXN) is currently increasing, with the pair currently being traded at 17.4904. This upward movement is primarily influenced by the US Federal Reserve’s more aggressive and optimistic approach.
…
This is a premium post.
[s2If !current_user_can(access_s2member_level4)]Please register for FREE REGISTER to read full post below containing analysis. In case of any error or you think you are not able to read the full post below, please email us at support#nehcap.com [lwa][/s2If] [s2If current_user_can(access_s2member_level1)]
- USD/MXN is on an uptrend, with the pair trading at 17.4904, driven by the hawkish stance of the US Federal Reserve.
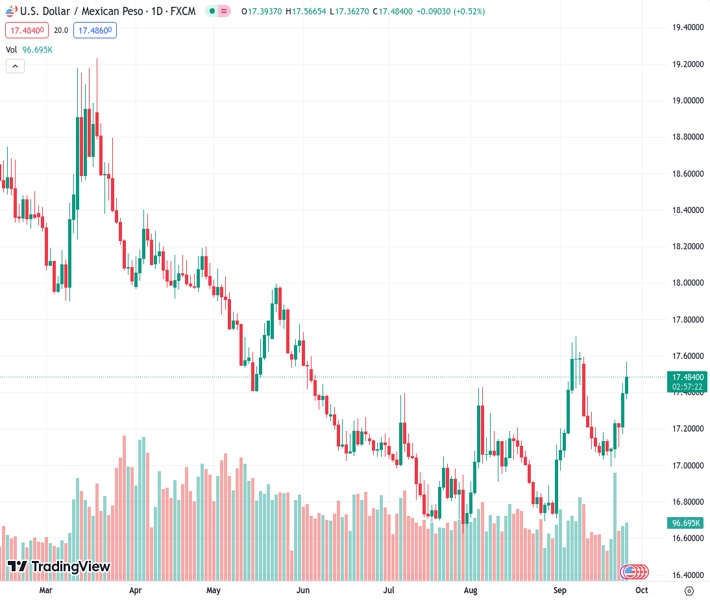
The pair currently trades last at 17.4830.
The previous day high was 17.4542 while the previous day low was 17.1723. The daily 38.2% Fib levels comes at 17.3465, expected to provide support. Similarly, the daily 61.8% fib level is at 17.28, expected to provide support.
The Mexican Peso (MXN) slips further against the US Dollar (USD) amid risk aversion and high US bond yields, driving price action in the Forex markets. Expectations that interest rates in the United States (US) would remain higher for an extended period underpins the USD. The USD/MXN is trading at 17.4904 after hitting a new two-week high.
The USD/MXN resumed its uptrend after the US Federal Reserve (Fed), despite holding rates unchanged, delivered a hawkish hold, as revealed by the “dot-plots” in the Summary of Economic Projections. Fed officials foresee rates at 5.6% in 2023 and 5.1% in 2024, higher than the 4.6% projected in June 2023.
Consequently, US Treasury bond yields have skyrocketed since Wednesday, with the US 10-year benchmark note rate gaining 4.34% or 19 basis points, currently at 4.548%. Although the CME FedWatch Tool does not price in another hike by the US central bank, Fed’s policymakers emphasized that curbing inflation towards its 2% goal is their primary objective.
Source: CME FedWatch Tool
Recently, Fed officials stressed that although a soft landing could be achieved, further tightening is needed, as the Minnesota Fed President Neil Kashkari expressed on Tuesday. He said, “After potentially one more 25-basis-point federal funds rate increase later this year, the FOMC holds policy at this level long enough to bring inflation back to target in a reasonable period of time.”
Data-wise, Consumer Confidence, as the Conference Board (CB) reported, reached a four-month low. This decline is attributed to a deteriorating economic outlook for the overall economy.
Earlier, housing data was revealed, as August’s Building Permits in the US increased from July’s 1.443 million to 1.541 million, indicating continued growth in construction. However, the housing market shows signs of weakness as New Home Sales plummeted by -8.7% compared to the 8% increase in July. The decline is mainly due to higher mortgage rates, as the Federal Reserve embarked on an aggressive tightening cycle that witnessed interest rates hit the 5.25%-5.505 area.
On the Mexican front, the lack of economic data left USD/MXN traders adrift to US Dollar dynamics. However, ahead of the week, the agenda will feature the Balance of Trade, Unemployment Rate, and the Bank of Mexico (Banxico) interest rate decision. On the US front, the docket would feature Fed speakers led by Bowman, Durable Goods Orders, GDP, Initial Jobless Claims, and the Fed’s preferred gauge for inflation, Core PCE.
From a technical standpoint, the USD/MXN is neutral-biased but slightly tilted to the upside, but it remains shy of registering a break to a new cycle high. That would be achieved with the exotic pair claiming the September 7 high of 17.7074, exposing the 200-day moving average (DMA) on the upside at 17.8604, followed by the psychological 18.0000 figure. Once cleared, the next resistance would emerge at the April 5 high at 18.4010, followed by the March 24 high at 18.7968.
Technical Levels: Supports and Resistances
USDMXN currently trading at 17.4785 at the time of writing. Pair opened at 17.395 and is trading with a change of 0.48 % .
| Overview | Overview.1 | |
|---|---|---|
| 0 | Today last price | 17.4785 |
| 1 | Today Daily Change | 0.0835 |
| 2 | Today Daily Change % | 0.4800 |
| 3 | Today daily open | 17.3950 |
The pair is trading above its 20 Daily moving average @ 17.2013, above its 50 Daily moving average @ 17.0516 , above its 100 Daily moving average @ 17.1916 and below its 200 Daily moving average @ 17.88
| Trends | Trends.1 | |
|---|---|---|
| 0 | Daily SMA20 | 17.2013 |
| 1 | Daily SMA50 | 17.0516 |
| 2 | Daily SMA100 | 17.1916 |
| 3 | Daily SMA200 | 17.8800 |
The previous day high was 17.4542 while the previous day low was 17.1723. The daily 38.2% Fib levels comes at 17.3465, expected to provide support. Similarly, the daily 61.8% fib level is at 17.28, expected to provide support.
Note the levels of interest below:
- Pivot support is noted at 17.2268, 17.0587, 16.945
- Pivot resistance is noted at 17.5086, 17.6223, 17.7905
| Levels | Levels.1 |
|---|---|
| Previous Daily High | 17.4542 |
| Previous Daily Low | 17.1723 |
| Previous Weekly High | 17.2506 |
| Previous Weekly Low | 16.9982 |
| Previous Monthly High | 17.4274 |
| Previous Monthly Low | 16.6945 |
| Daily Fibonacci 38.2% | 17.3465 |
| Daily Fibonacci 61.8% | 17.2800 |
| Daily Pivot Point S1 | 17.2268 |
| Daily Pivot Point S2 | 17.0587 |
| Daily Pivot Point S3 | 16.9450 |
| Daily Pivot Point R1 | 17.5086 |
| Daily Pivot Point R2 | 17.6223 |
| Daily Pivot Point R3 | 17.7905 |
[/s2If]
Download Nehcap EAWe have two EAs that are operational on our LIVE accounts.
- EA-FIX: Check out the details here. Download EA-FIX . EA-FIX is a non-grid HFT scalper.
- EA-GROWTH: High quality low dd EA using trend grids. Download EA_GROWTHJoin Our Telegram Group


