The USD/INR pair has increased for two consecutive days and reached a high point not seen in several days on Tuesday.
…
This is a premium post.
[s2If !current_user_can(access_s2member_level4)]Please register for FREE REGISTER to read full post below containing analysis. In case of any error or you think you are not able to read the full post below, please email us at support#nehcap.com [lwa][/s2If] [s2If current_user_can(access_s2member_level1)]
- USD/INR scales higher for the second straight day and touches a multi-day top on Tuesday.
The pair currently trades last at 83.1940.
The previous day high was 83.2529 while the previous day low was 82.975. The daily 38.2% Fib levels comes at 83.0812, expected to provide support. Similarly, the daily 61.8% fib level is at 83.1468, expected to provide support.
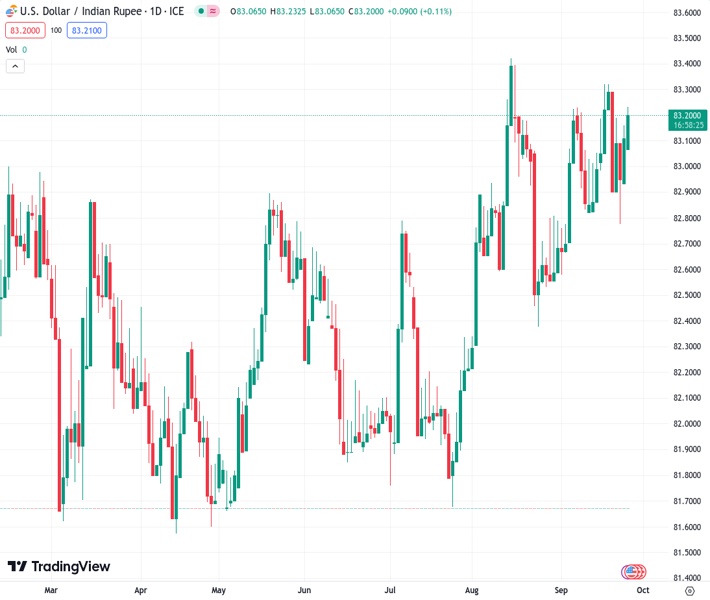
The USD/INR pair gains some positive traction for the second successive day on Tuesday and climbs to a multi-day peak during the Asian session. Spot prices currently trade around the 83.20 area, up 0.15% for the day, and remain well within the striking distance of the monthly peak touched last week.
The prospects for further policy tightening by the Federal Reserve (Fed) continue to push the US Treasury bond yields higher and underpin the US Dollar (USD). Apart from this, the risk-off impulse – as depicted by a weaker tone around the equity markets – assists the safe-haven Greenback to stand tall near its highest level since December 2022 touched on Monday. This, in turn, is seen as a key factor that continues to act as a tailwind for the USD/INR pair.
From a technical perspective, oscillators on the daily chart are yet to gain any meaningful positive traction and warrant caution for aggressive bullish traders. Hence, it will be prudent to wait for some follow-through buying beyond the 82.30 area, or the monthly top, before positioning for further appreciating move. The USD/INR pair might then surpass the all-time peak, around the 83.40-83.45 region touched on August 15, and aim to conquer the 84.00 round figure.
On the flip side, any corrective decline might now find some support near the 83.00 mark ahead of Friday’s swing low, around the 82.80-82.75 region. This is closely followed by the upward-sloping 100-day Simple Moving Average (SMA), currently pegged near the mid-82.00s, and the 200-day SMA, around the 82.35 region. The latter should act as a key pivotal point for the USD/INR pair, which if broken decisively will be seen as a fresh trigger for bearish traders.
Spot prices might then turn vulnerable to accelerate the downfall towards the 82.00 mark. The downward trajectory could get extended further and eventually drag the USD/INR pair to the July swing low, around the 81.70-81.65 region.
Technical Levels: Supports and Resistances
USDINR currently trading at 83.1865 at the time of writing. Pair opened at 83.0765 and is trading with a change of 0.13 % .
| Overview | Overview.1 | |
|---|---|---|
| 0 | Today last price | 83.1865 |
| 1 | Today Daily Change | 0.1100 |
| 2 | Today Daily Change % | 0.1300 |
| 3 | Today daily open | 83.0765 |
The pair remains strongly bullish on the daily timeframe. It trades above its 20 SMA @ 83.0096, 50 SMA 82.7822, 100 SMA @ 82.5464 and 200 SMA @ 82.3638.
| Trends | Trends.1 | |
|---|---|---|
| 0 | Daily SMA20 | 83.0096 |
| 1 | Daily SMA50 | 82.7822 |
| 2 | Daily SMA100 | 82.5464 |
| 3 | Daily SMA200 | 82.3638 |
The previous day high was 83.2529 while the previous day low was 82.975. The daily 38.2% Fib levels comes at 83.0812, expected to provide support. Similarly, the daily 61.8% fib level is at 83.1468, expected to provide support.
Note the levels of interest below:
- Pivot support is noted at 82.9501, 82.8236, 82.6722
- Pivot resistance is noted at 83.2279, 83.3793, 83.5058
| Levels | Levels.1 |
|---|---|
| Previous Daily High | 83.2529 |
| Previous Daily Low | 82.9750 |
| Previous Weekly High | 83.8456 |
| Previous Weekly Low | 82.5125 |
| Previous Monthly High | 83.5505 |
| Previous Monthly Low | 82.2240 |
| Daily Fibonacci 38.2% | 83.0812 |
| Daily Fibonacci 61.8% | 83.1468 |
| Daily Pivot Point S1 | 82.9501 |
| Daily Pivot Point S2 | 82.8236 |
| Daily Pivot Point S3 | 82.6722 |
| Daily Pivot Point R1 | 83.2279 |
| Daily Pivot Point R2 | 83.3793 |
| Daily Pivot Point R3 | 83.5058 |
[/s2If]
Download Nehcap EAWe have two EAs that are operational on our LIVE accounts.
- EA-FIX: Check out the details here. Download EA-FIX . EA-FIX is a non-grid HFT scalper.
- EA-GROWTH: High quality low dd EA using trend grids. Download EA_GROWTHJoin Our Telegram Group


