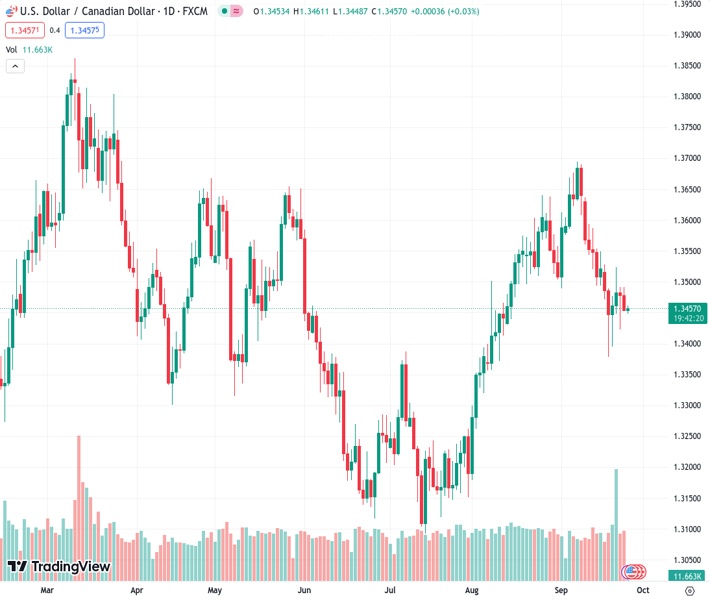
The USDCAD pair remains within a tight trading range around 1.3458 on Tuesday.
…
This is a premium post.
[s2If !current_user_can(access_s2member_level4)]Please register for FREE REGISTER to read full post below containing analysis. In case of any error or you think you are not able to read the full post below, please email us at support#nehcap.com [lwa][/s2If] [s2If current_user_can(access_s2member_level1)]
- USD/CAD consolidates in a narrow trading band near 1.3458 on Tuesday.
The pair currently trades last at 1.34572.
The previous day high was 1.3492 while the previous day low was 1.3453. The daily 38.2% Fib levels comes at 1.3468, expected to provide resistance. Similarly, the daily 61.8% fib level is at 1.3477, expected to provide resistance.
The USD/CAD pair oscillates in a narrow range during the early Asian session on Tuesday. The weakening of the Loonie is weighed by the downtick in oil prices while the higher for longer narrative in the US lifts the US Dollar (USD) across the board. As of writing, USD/CAD is trading around 1.3457, gaining 0.02% on the day.
The US Dollar Index (DXY), a measure of the value of the USD relative to a basket of foreign currencies, hovers around 105.95 after retreating from the highest level since November of 106.09 amid the USD demand and a rising of the US 10-year yield to the highest level since October 2007.
That said, the oil price edges lower for two straight days on Tuesday, which undermines the commodity-linked Loonie and might cap the upside for the USD/CAD pair as the country is the leading oil exporter to the US.
Most Fed officials still anticipate further rate hikes later this year. Susan Collins and Mary Daly, Presidents of the Federal Reserve Banks of Boston and San Francisco, stressed that, although inflation is slowing, future rate rises are likely. While Chicago Fed President Austan Goolsbee said that a soft landing is possible, inflation risks remain elevated, and the Fed should be fully committed to bringing inflation to 2%. These hawkish comments from Fed officials boost the USD and act as a tailwind for the USD/CAD pair.
Moving on, the US Consumer Confidence for September and housing data will be due later on Tuesday. On Thursday, the US Gross Domestic Product (GDP) Annualized for the second quarter will be released. The closely watched event will be the Core Personal Consumption Expenditure (PCE) Price Index, the Fed’s preferred measure of consumer inflation, due on Friday. The annual figure is expected to drop from 4.2% to 3.9%. Also, Canadian GDP numbers will be due on Friday. Market players will take cues from these figures and find a clear direction in the USD/CAD pair.
Technical Levels: Supports and Resistances
USDCAD currently trading at 1.346 at the time of writing. Pair opened at 1.3454 and is trading with a change of 0.04 % .
| Overview | Overview.1 | |
|---|---|---|
| 0 | Today last price | 1.3460 |
| 1 | Today Daily Change | 0.0006 |
| 2 | Today Daily Change % | 0.0400 |
| 3 | Today daily open | 1.3454 |
The pair is trading below its 20 Daily moving average @ 1.3545, above its 50 Daily moving average @ 1.3446 , above its 100 Daily moving average @ 1.34 and below its 200 Daily moving average @ 1.3461
| Trends | Trends.1 | |
|---|---|---|
| 0 | Daily SMA20 | 1.3545 |
| 1 | Daily SMA50 | 1.3446 |
| 2 | Daily SMA100 | 1.3400 |
| 3 | Daily SMA200 | 1.3461 |
The previous day high was 1.3492 while the previous day low was 1.3453. The daily 38.2% Fib levels comes at 1.3468, expected to provide resistance. Similarly, the daily 61.8% fib level is at 1.3477, expected to provide resistance.
Note the levels of interest below:
- Pivot support is noted at 1.3441, 1.3428, 1.3402
- Pivot resistance is noted at 1.3479, 1.3505, 1.3518
| Levels | Levels.1 |
|---|---|
| Previous Daily High | 1.3492 |
| Previous Daily Low | 1.3453 |
| Previous Weekly High | 1.3528 |
| Previous Weekly Low | 1.3379 |
| Previous Monthly High | 1.3640 |
| Previous Monthly Low | 1.3184 |
| Daily Fibonacci 38.2% | 1.3468 |
| Daily Fibonacci 61.8% | 1.3477 |
| Daily Pivot Point S1 | 1.3441 |
| Daily Pivot Point S2 | 1.3428 |
| Daily Pivot Point S3 | 1.3402 |
| Daily Pivot Point R1 | 1.3479 |
| Daily Pivot Point R2 | 1.3505 |
| Daily Pivot Point R3 | 1.3518 |
[/s2If]
Download Nehcap EAWe have two EAs that are operational on our LIVE accounts.
- EA-FIX: Check out the details here. Download EA-FIX . EA-FIX is a non-grid HFT scalper.
- EA-GROWTH: High quality low dd EA using trend grids. Download EA_GROWTHJoin Our Telegram Group


