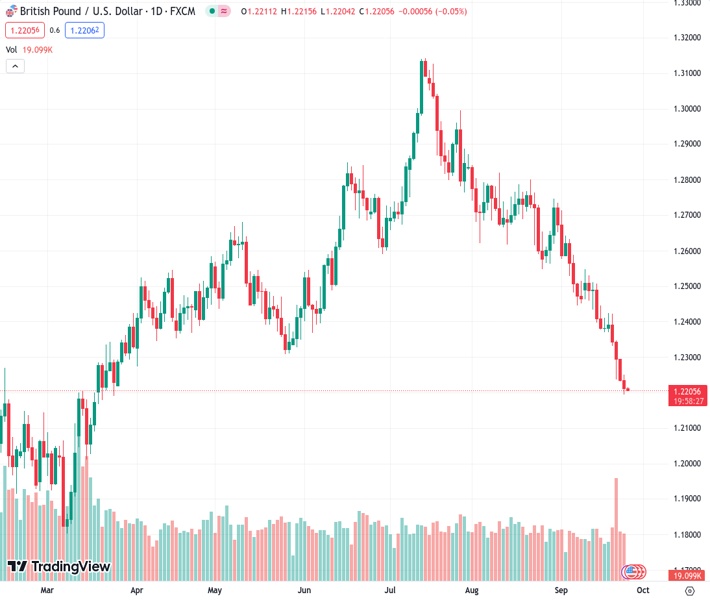
The GBPUSD pair, currently at a rate of 1.22053, remains at a relatively low level compared to previous months due to a combination of factors that are weakening its position.
…
This is a premium post.
[s2If !current_user_can(access_s2member_level4)]Please register for FREE REGISTER to read full post below containing analysis. In case of any error or you think you are not able to read the full post below, please email us at support#nehcap.com [lwa][/s2If] [s2If current_user_can(access_s2member_level1)]
- GBP/USD languishes near a multi-month low and is undermined by a combination of factors.
The pair currently trades last at 1.22053.
The previous day high was 1.2256 while the previous day low was 1.2194. The daily 38.2% Fib levels comes at 1.2218, expected to provide resistance. Similarly, the daily 61.8% fib level is at 1.2232, expected to provide resistance.
The GBP/USD pair enters a bearish consolidation phase during the Asian session on Tuesday and oscillates in a range just above its lowest level since March 17 touched the previous day. Spot prices currently trade around the 1.2220 area, though the fundamental backdrop favours bearish traders and supports prospects for an extension of the well-established downtrend witnessed over the past two months or so.
The US Dollar (USD) stands tall near the YTD peak set on Monday and is seen as a key factor that continues to act as a headwind for the GBP/USD pair. The Federal Reserve (Fed) stuck to its hawkish stance at the September policy meeting last week and reiterated the ‘higher-for-longer’ interest rates narrative. In fact, the US central bank warned that still-sticky inflation was likely to attract at least one more interest rate hike by the end of this year. Furthermore, policymakers see just two rate cuts in 2024 as compared to four projected previously.
Furthermore, the incoming resilient US macro data supports prospects for further policy tightening by the Fed, which remains supportive of the recent blowout rally in the US Treasury bond yields and underpins the Greenback. The yield on the rate-sensitive two-year US government bond touched a 17-year peak and the benchmark 10-year Treasury yield climbed beyond the 4.50% threshold for the first time since 2007. Apart from this, the Bank of England’s (BoE) surprise pause last Thursday turns out to be another factor weighing on the GBP/USD pair.
The UK central bank decided to keep the main policy rate unchanged, at a 15-year high level of 5.25%, ending a run of 14 straight hikes since December 2021 in the wake of the recent deceleration of inflation and signs that economic growth is slowing. This, in turn, supports prospects for a further depreciating move for the GBP/USD pair, though the extremely oversold Relative Strength Index (RSI) on the daily chart holds back bearish traders from placing fresh bets. Hence, it will be prudent to wait for some consolidation or a modest bounce before the next leg down.
There isn’t any relevant market-moving economic data due for release from the UK on Tuesday, leaving the GBP/USD pair at the mercy of the USD price dynamics. Later during the early North American session, traders will take cues from the US economic docket – featuring the release of the Conference Board’s Consumer Confidence Index, New Home Sales data and the Richmond Manufacturing Index – to grab short-term opportunities.
Technical Levels: Supports and Resistances
GBPUSD currently trading at 1.2209 at the time of writing. Pair opened at 1.2212 and is trading with a change of -0.02 % .
| Overview | Overview.1 | |
|---|---|---|
| 0 | Today last price | 1.2209 |
| 1 | Today Daily Change | -0.0003 |
| 2 | Today Daily Change % | -0.0200 |
| 3 | Today daily open | 1.2212 |
The pair remains strongly bearish on the daily time frame. It trades below the 20 SMA @ 1.2471, 50 SMA 1.2649, 100 SMA @ 1.2639 and 200 SMA @ 1.2434.
| Trends | Trends.1 | |
|---|---|---|
| 0 | Daily SMA20 | 1.2471 |
| 1 | Daily SMA50 | 1.2649 |
| 2 | Daily SMA100 | 1.2639 |
| 3 | Daily SMA200 | 1.2434 |
The previous day high was 1.2256 while the previous day low was 1.2194. The daily 38.2% Fib levels comes at 1.2218, expected to provide resistance. Similarly, the daily 61.8% fib level is at 1.2232, expected to provide resistance.
Note the levels of interest below:
- Pivot support is noted at 1.2185, 1.2159, 1.2123
- Pivot resistance is noted at 1.2247, 1.2282, 1.2309
| Levels | Levels.1 |
|---|---|
| Previous Daily High | 1.2256 |
| Previous Daily Low | 1.2194 |
| Previous Weekly High | 1.2425 |
| Previous Weekly Low | 1.2231 |
| Previous Monthly High | 1.2841 |
| Previous Monthly Low | 1.2548 |
| Daily Fibonacci 38.2% | 1.2218 |
| Daily Fibonacci 61.8% | 1.2232 |
| Daily Pivot Point S1 | 1.2185 |
| Daily Pivot Point S2 | 1.2159 |
| Daily Pivot Point S3 | 1.2123 |
| Daily Pivot Point R1 | 1.2247 |
| Daily Pivot Point R2 | 1.2282 |
| Daily Pivot Point R3 | 1.2309 |
[/s2If]
Download Nehcap EAWe have two EAs that are operational on our LIVE accounts.
- EA-FIX: Check out the details here. Download EA-FIX . EA-FIX is a non-grid HFT scalper.
- EA-GROWTH: High quality low dd EA using trend grids. Download EA_GROWTHJoin Our Telegram Group


