Some sellers are drawn towards the gold price of $1,915 due to increased demand for the USD.
…
This is a premium post.
[s2If !current_user_can(access_s2member_level4)]Please register for FREE REGISTER to read full post below containing analysis. In case of any error or you think you are not able to read the full post below, please email us at support#nehcap.com [lwa][/s2If] [s2If current_user_can(access_s2member_level1)]
- Gold price attracts some sellers around $1,915 amid the USD demand.
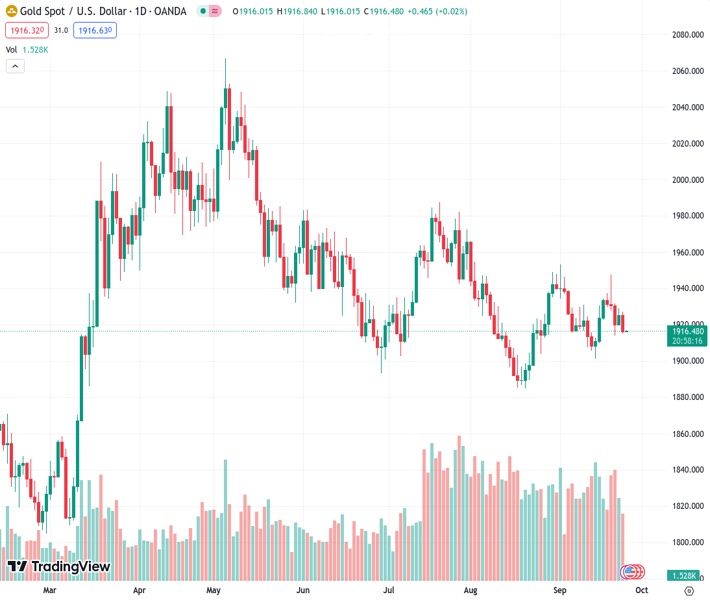
The pair currently trades last at 1916.23.
The previous day high was 1929.16 while the previous day low was 1919.52. The daily 38.2% Fib levels comes at 1925.48, expected to provide resistance. Similarly, the daily 61.8% fib level is at 1923.2, expected to provide resistance.
Gold price (XAU/USD) struggles to gain around $1,915 during the early Asian session on Tuesday. Gold price is weighed by a rally in US Dollar (USD) and US higher yield.
Meanwhile, the US Dollar Index (DXY), a measure of the value of the USD relative to a basket of foreign currencies, hovers around 105.95 after retreating from the highest level since November of 106.09 amid the higher for longer narratives in the US. Additionally, the 10-year yield climbed to 4.53%, a level not seen since October 2007.
Most Fed officials still expect the additional rate to rise later this year. The Federal Reserve Banks of Boston and San Francisco Presidents, Susan Collins and Mary Daly, emphasized that although inflation is cooling down, additional rate hikes would be necessary. While the Chicago Fed President Austan Goolsbee said that a soft landing is possible, inflation risks remain tilted to the upside and the Fed should have 100% commitment to returning inflation to 2%. It’s worth noting that rising interest rates raise the opportunity cost of investing in non-yielding assets, implying a negative outlook for XAU/USD.
Moving on, the US Gross Domestic Product (GDP) Annualized for the second quarter will be due on Thursday. The closely watched event this week will be the Core Personal Consumption Expenditure (PCE) Price Index, the Fed’s preferred measure of consumer inflation, due on Friday. The annual figure is expected to drop from 4.2% to 3.9%. Market players will take cues from these figures and find a clear direction in XAU/USD.
On the one-hour chart, gold price holds below the 50- and 100-hour Exponential Moving Averages (EMAs), which mean the past of least resistance is to the downside. Meanwhile, the Relative Strength Index (RSI) is located in bearish territory below 50, activating the bearish momentum for gold price.
Resistance level: $1,925, $1,945 and $1,970
Support level: $1,900, $1,885 and $1,865
Technical Levels: Supports and Resistances
XAUUSD currently trading at 1916.49 at the time of writing. Pair opened at 1925.26 and is trading with a change of -0.46 % .
| Overview | Overview.1 | |
|---|---|---|
| 0 | Today last price | 1916.49 |
| 1 | Today Daily Change | -8.77 |
| 2 | Today Daily Change % | -0.46 |
| 3 | Today daily open | 1925.26 |
The pair remains strongly bearish on the daily time frame. It trades below the 20 SMA @ 1925.97, 50 SMA 1930.03, 100 SMA @ 1942.27 and 200 SMA @ 1925.57.
| Trends | Trends.1 | |
|---|---|---|
| 0 | Daily SMA20 | 1925.97 |
| 1 | Daily SMA50 | 1930.03 |
| 2 | Daily SMA100 | 1942.27 |
| 3 | Daily SMA200 | 1925.57 |
The previous day high was 1929.16 while the previous day low was 1919.52. The daily 38.2% Fib levels comes at 1925.48, expected to provide resistance. Similarly, the daily 61.8% fib level is at 1923.2, expected to provide resistance.
Note the levels of interest below:
- Pivot support is noted at 1920.13, 1915.01, 1910.49
- Pivot resistance is noted at 1929.77, 1934.29, 1939.41
| Levels | Levels.1 |
|---|---|
| Previous Daily High | 1929.16 |
| Previous Daily Low | 1919.52 |
| Previous Weekly High | 1947.47 |
| Previous Weekly Low | 1913.95 |
| Previous Monthly High | 1966.08 |
| Previous Monthly Low | 1884.85 |
| Daily Fibonacci 38.2% | 1925.48 |
| Daily Fibonacci 61.8% | 1923.20 |
| Daily Pivot Point S1 | 1920.13 |
| Daily Pivot Point S2 | 1915.01 |
| Daily Pivot Point S3 | 1910.49 |
| Daily Pivot Point R1 | 1929.77 |
| Daily Pivot Point R2 | 1934.29 |
| Daily Pivot Point R3 | 1939.41 |
[/s2If]
Download Nehcap EAWe have two EAs that are operational on our LIVE accounts.
- EA-FIX: Check out the details here. Download EA-FIX . EA-FIX is a non-grid HFT scalper.
- EA-GROWTH: High quality low dd EA using trend grids. Download EA_GROWTHJoin Our Telegram Group


