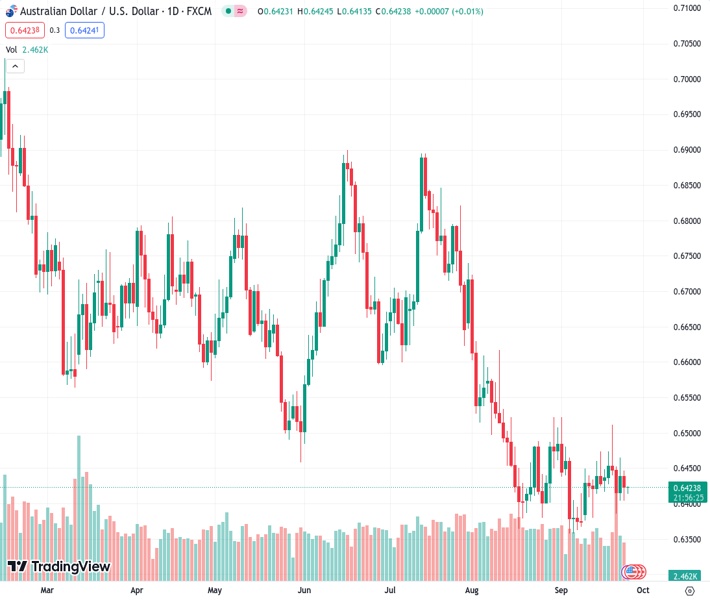
The AUDUSD pair is currently trading at 0.6423, which is a decrease of 0.25% compared to the previous trading session. This drop is attributed to the US Dollar Index (DXY) reaching a ten-month high at 106.09. The increase in the DXY is primarily due to the rise in US bond yields.
…
This is a premium post.
[s2If !current_user_can(access_s2member_level4)]Please register for FREE REGISTER to read full post below containing analysis. In case of any error or you think you are not able to read the full post below, please email us at support#nehcap.com [lwa][/s2If] [s2If current_user_can(access_s2member_level1)]
- AUD/USD trades at 0.6423, experiencing a 0.25% drop on Monday, as the US Dollar Index (DXY) reaches a ten-month high at 106.09, driven by elevated US bond yields.
The pair currently trades last at 0.64231.
The previous day high was 0.6465 while the previous day low was 0.6404. The daily 38.2% Fib levels comes at 0.6442, expected to provide resistance. Similarly, the daily 61.8% fib level is at 0.6427, expected to provide resistance.
The Australian Dollar (AUD) lost some ground against the US Dollar (USD) as the latter strengthened the most in nine months, underpinned by elevated US bond yields. Hence, the AUD/USD is trading at 0.6423, printing minuscule gains as the Asian session begins, but on Monday, it dropped 0.25%.
Wall Street finished Monday’s session with gains led by the Nasdaq and followed by the S&P 500. The Greenback remains in the driver’s seat as investors brace for the US Federal Reserve’s mantra “higher for longer,” as US Treasury bond yields touch multi-year highs. The US 10-year T-bond rate hit 4.533% during the session, while the US Dollar Index (DXY) rose to a ten-month high at 106.09.
Data-wise, the Chicago Fed National Activity Index plunged to -0.16 in August from 0.07 in July, while the Dallas Fed Manufacturing Index plummeted to -18.1 in September from -17.2 the prior month.
Federal Reserve speakers in the central bank adopted a cautious stance, mainly Boston and San Francisco Fed Presidents Susan Collins and Mary Daly. Both stressed the Fed should be patient on monetary policy but haven’t ruled out another rate hike. Recently, the Chicago Fed President Austan Goolsbee said that a soft landing is possible, but inflation risks remain tilted to the upside.
Meanwhile, AUD/USD traders would take cues from the Australian economic docket with the release of the Reserve Bank of Australia (RBA) Conference in inflation. On the US front, the docket would release the S&P/Case-Shiller Home Prices, alongside housing data and the CB Consumer Confidence.
The Aussie’s daily chart portrays the currency pair as neutral to downward biased. Currently is consolidated at around the 0.6400 mark, but a bearish-harami candlestick chart pattern could pave the way for further losses. The first support is seen at the current exchange rate, at around two and a half years of support trendline. A breach of the latter would open the door to test the September 4 low of 0.6357, followed by the November 22 swing low of 0.6272. Conversely, if the pair climbs past the 0.6500 figure, the next resistance is at the 50-day moving average (DMA) at 0.6671.
Technical Levels: Supports and Resistances
AUDUSD currently trading at 0.6424 at the time of writing. Pair opened at 0.6441 and is trading with a change of -0.26 % .
| Overview | Overview.1 | |
|---|---|---|
| 0 | Today last price | 0.6424 |
| 1 | Today Daily Change | -0.0017 |
| 2 | Today Daily Change % | -0.2600 |
| 3 | Today daily open | 0.6441 |
The pair remains strongly bearish on the daily time frame. It trades below the 20 SMA @ 0.6432, 50 SMA 0.6523, 100 SMA @ 0.6605 and 200 SMA @ 0.6697.
| Trends | Trends.1 | |
|---|---|---|
| 0 | Daily SMA20 | 0.6432 |
| 1 | Daily SMA50 | 0.6523 |
| 2 | Daily SMA100 | 0.6605 |
| 3 | Daily SMA200 | 0.6697 |
The previous day high was 0.6465 while the previous day low was 0.6404. The daily 38.2% Fib levels comes at 0.6442, expected to provide resistance. Similarly, the daily 61.8% fib level is at 0.6427, expected to provide resistance.
Note the levels of interest below:
- Pivot support is noted at 0.6408, 0.6375, 0.6347
- Pivot resistance is noted at 0.647, 0.6498, 0.6531
| Levels | Levels.1 |
|---|---|
| Previous Daily High | 0.6465 |
| Previous Daily Low | 0.6404 |
| Previous Weekly High | 0.6511 |
| Previous Weekly Low | 0.6385 |
| Previous Monthly High | 0.6724 |
| Previous Monthly Low | 0.6364 |
| Daily Fibonacci 38.2% | 0.6442 |
| Daily Fibonacci 61.8% | 0.6427 |
| Daily Pivot Point S1 | 0.6408 |
| Daily Pivot Point S2 | 0.6375 |
| Daily Pivot Point S3 | 0.6347 |
| Daily Pivot Point R1 | 0.6470 |
| Daily Pivot Point R2 | 0.6498 |
| Daily Pivot Point R3 | 0.6531 |
[/s2If]
Download Nehcap EAWe have two EAs that are operational on our LIVE accounts.
- EA-FIX: Check out the details here. Download EA-FIX . EA-FIX is a non-grid HFT scalper.
- EA-GROWTH: High quality low dd EA using trend grids. Download EA_GROWTHJoin Our Telegram Group


