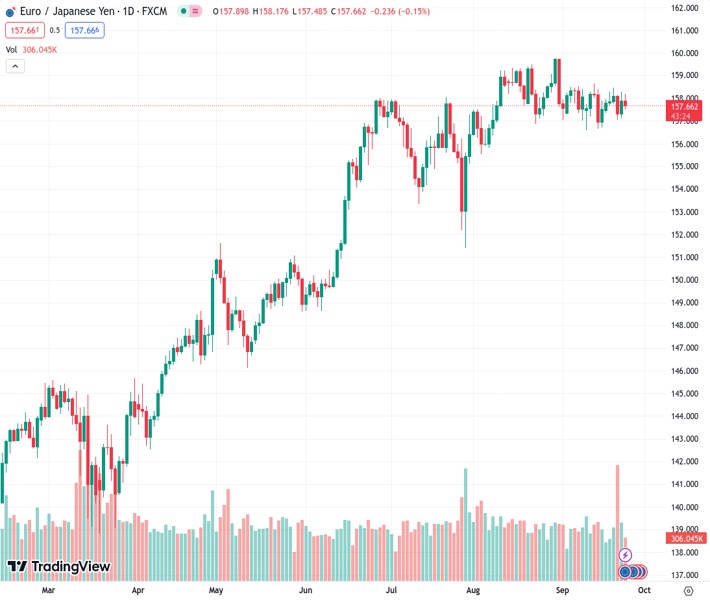
The EURJPY pair is currently trading at 157.667 and has experienced a decrease of 0.19% due to underlying factors. It has remained at a low level for the past ten days without any significant changes.
…
This is a premium post.
[s2If !current_user_can(access_s2member_level4)]Please register for FREE REGISTER to read full post below containing analysis. In case of any error or you think you are not able to read the full post below, please email us at support#nehcap.com [lwa][/s2If] [s2If current_user_can(access_s2member_level1)]
- EUR/JPY holds losses of 0.19% on fundamental reasons while it remains subdued for ten consecutive days.
The pair currently trades last at 157.667.
The previous day high was 158.28 while the previous day low was 157.12. The daily 38.2% Fib levels comes at 157.84, expected to provide resistance. Similarly, the daily 61.8% fib level is at 157.56, expected to provide support.
The EUR/JPY remains subdued for the tenth-straight day, capped on the upside by the Kijun-Sen at 158.17, while the distance between the spot price and the Ichimoku Cloud (Kumo) shrinks, suggesting that downside risks are emerging. Hence, the cross-pair is trading at 1573.60, down 0.19%.
A fundamental reason behind the recent Euro (EUR) weakness is data showing the bloc is headed to a recession. At the same time, the European Central Bank (ECB) holds rates as fears of economic growth are tilted to the downside. Nevertheless, the ECB is adopting the Fed’s mantra of keeping rates higher for longer. That and fears that Japanese authorities could intervene in the Forex market and propel the Yen keeps traders parked on the sidelines.
The daily chart portrays the EUR/JPY trades sideways, with immediate resistance at the Kijun-Sen at 158.17. A breach of that level would expose the September 13 high of 158.65 before rallying to 159.00. Conversely, the pair’s first support would be the September 21 daily low of 157.03, followed by the top of the kumo at 156.86.
The hourly chart portrays the pair as neutral to downward biased, as it has achieved a successive series of lower highs, though it’s pending a lower low below September 21 at 157.03. In addition, the exchange rate is below the Kumo, while the Chikou Span sits below the price action and the Kumo, further confirming the bearish bias.
The EUR/JPY first support would be the daily low of today at 157.48, followed by last Friday’s low of 157.11. A breach of the latter would expose the 157.03, followed by the 157.00 figure. Conversely, the first resistance would be the Senkou Span B at 157.69, followed by the Tenkan-Sen’s confluence and the Kumo’s top at 157.79 before challenging 158.00.
Technical Levels: Supports and Resistances
EURJPY currently trading at 157.65 at the time of writing. Pair opened at 157.98 and is trading with a change of -0.21 % .
| Overview | Overview.1 | |
|---|---|---|
| 0 | Today last price | 157.65 |
| 1 | Today Daily Change | -0.33 |
| 2 | Today Daily Change % | -0.21 |
| 3 | Today daily open | 157.98 |
The pair is trading below its 20 Daily moving average @ 158.04, above its 50 Daily moving average @ 157.5 , above its 100 Daily moving average @ 154.92 and above its 200 Daily moving average @ 149.07
| Trends | Trends.1 | |
|---|---|---|
| 0 | Daily SMA20 | 158.04 |
| 1 | Daily SMA50 | 157.50 |
| 2 | Daily SMA100 | 154.92 |
| 3 | Daily SMA200 | 149.07 |
The previous day high was 158.28 while the previous day low was 157.12. The daily 38.2% Fib levels comes at 157.84, expected to provide resistance. Similarly, the daily 61.8% fib level is at 157.56, expected to provide support.
Note the levels of interest below:
- Pivot support is noted at 157.31, 156.63, 156.15
- Pivot resistance is noted at 158.47, 158.96, 159.63
| Levels | Levels.1 |
|---|---|
| Previous Daily High | 158.28 |
| Previous Daily Low | 157.12 |
| Previous Weekly High | 158.45 |
| Previous Weekly Low | 157.04 |
| Previous Monthly High | 159.76 |
| Previous Monthly Low | 155.53 |
| Daily Fibonacci 38.2% | 157.84 |
| Daily Fibonacci 61.8% | 157.56 |
| Daily Pivot Point S1 | 157.31 |
| Daily Pivot Point S2 | 156.63 |
| Daily Pivot Point S3 | 156.15 |
| Daily Pivot Point R1 | 158.47 |
| Daily Pivot Point R2 | 158.96 |
| Daily Pivot Point R3 | 159.63 |
[/s2If]
Download Nehcap EAWe have two EAs that are operational on our LIVE accounts.
- EA-FIX: Check out the details here. Download EA-FIX . EA-FIX is a non-grid HFT scalper.
- EA-GROWTH: High quality low dd EA using trend grids. Download EA_GROWTHJoin Our Telegram Group


