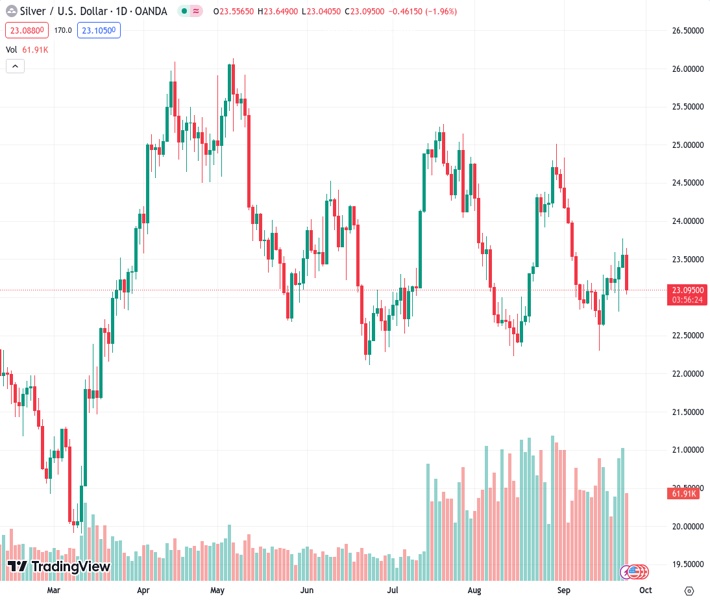
Silver’s value against the US dollar, represented by #XAGUSD, experiences a decline and loses stability on Monday, moving closer to the $23.00 mark.
…
This is a premium post.
[s2If !current_user_can(access_s2member_level4)]Please register for FREE REGISTER to read full post below containing analysis. In case of any error or you think you are not able to read the full post below, please email us at support#nehcap.com [lwa][/s2If] [s2If current_user_can(access_s2member_level1)]
- Silver trips and tumbles in Monday trading, heading towards $23.00.
The pair currently trades last at 23.104.
The previous day high was 23.78 while the previous day low was 23.39. The daily 38.2% Fib levels comes at 23.63, expected to provide resistance. Similarly, the daily 61.8% fib level is at 23.54, expected to provide resistance.
Silver is falling further back to kick off the new trading week, testing into familiar lows after last Friday’s bounce couldn’t be sustained.
The Federal Reserve (Fed) is set to see interest rates holding higher for longer than previously expected, and the boost to the US Dollar Index (DXY) is capping off recent upside swings for the XAG/USD.
After the Fed upped their interest rate forecast, or “dot plot” last week, the US central bank expects interest rates to only decline half a percent by the end of 2024. The Federal Open Market Committee (FOMC) previously saw end-2024 rates at 4.6%, but sticky inflation complications saw the Fed up their forecast to 5.1%.
On the hourly candles, Silver is looking to build a floor near the 200-hour Simple Moving Average (SMA) near $23.15 after tumbling around 2.5% from Monday’s highs near $23.65.
Intraday upside momentum will be looking to recapture familiar territory north of the 100-hour SMA currently settling near $23.35.
Silver is suffering from a notable lack of meaningful trend momentum in the long-term, with the XAG/USD cycling the 200-day SMA on daily candlesticks.
Price action is constrained to the middle as Silver consolidates, with lower highs and slightly higher lows trapping XAG/USD into the midrange.
Swing lows are pricing in near $22.40, with the top end set to run into a descending trendline near $24.40.
Technical Levels: Supports and Resistances
XAGUSD currently trading at 23.11 at the time of writing. Pair opened at 23.55 and is trading with a change of -1.87 % .
| Overview | Overview.1 | |
|---|---|---|
| 0 | Today last price | 23.11 |
| 1 | Today Daily Change | -0.44 |
| 2 | Today Daily Change % | -1.87 |
| 3 | Today daily open | 23.55 |
The pair remains strongly bearish on the daily time frame. It trades below the 20 SMA @ 23.51, 50 SMA 23.67, 100 SMA @ 23.63 and 200 SMA @ 23.47.
| Trends | Trends.1 | |
|---|---|---|
| 0 | Daily SMA20 | 23.51 |
| 1 | Daily SMA50 | 23.67 |
| 2 | Daily SMA100 | 23.63 |
| 3 | Daily SMA200 | 23.47 |
The previous day high was 23.78 while the previous day low was 23.39. The daily 38.2% Fib levels comes at 23.63, expected to provide resistance. Similarly, the daily 61.8% fib level is at 23.54, expected to provide resistance.
Note the levels of interest below:
- Pivot support is noted at 23.37, 23.19, 22.98
- Pivot resistance is noted at 23.75, 23.96, 24.14
| Levels | Levels.1 |
|---|---|
| Previous Daily High | 23.78 |
| Previous Daily Low | 23.39 |
| Previous Weekly High | 23.78 |
| Previous Weekly Low | 22.81 |
| Previous Monthly High | 25.02 |
| Previous Monthly Low | 22.23 |
| Daily Fibonacci 38.2% | 23.63 |
| Daily Fibonacci 61.8% | 23.54 |
| Daily Pivot Point S1 | 23.37 |
| Daily Pivot Point S2 | 23.19 |
| Daily Pivot Point S3 | 22.98 |
| Daily Pivot Point R1 | 23.75 |
| Daily Pivot Point R2 | 23.96 |
| Daily Pivot Point R3 | 24.14 |
[/s2If]
Download Nehcap EAWe have two EAs that are operational on our LIVE accounts.
- EA-FIX: Check out the details here. Download EA-FIX . EA-FIX is a non-grid HFT scalper.
- EA-GROWTH: High quality low dd EA using trend grids. Download EA_GROWTHJoin Our Telegram Group


