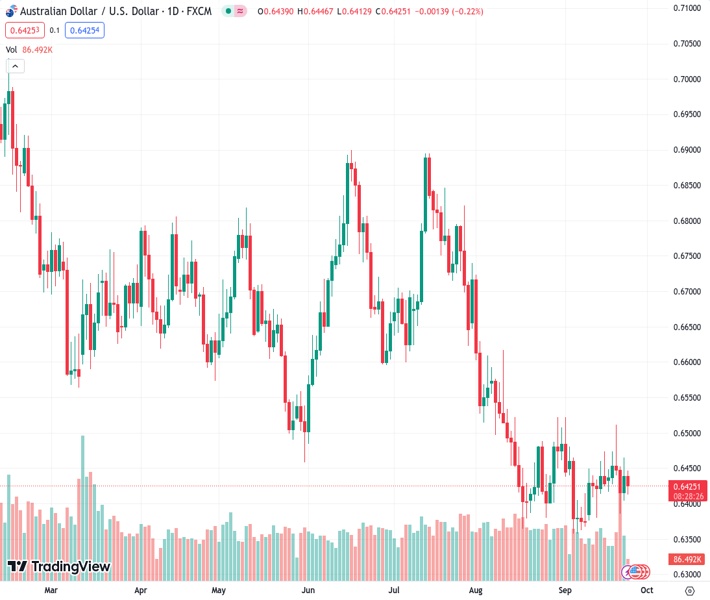
The AUDUSD pair is fluctuating around the 0.6420 level, mirroring the sideways movement of the US Dollar.
…
This is a premium post.
[s2If !current_user_can(access_s2member_level4)]Please register for FREE REGISTER to read full post below containing analysis. In case of any error or you think you are not able to read the full post below, please email us at support#nehcap.com [lwa][/s2If] [s2If current_user_can(access_s2member_level1)]
- AUD/USD trades back and forth near 0.6420, following the footprints of the sideways US Dollar.
The pair currently trades last at 0.64244.
The previous day high was 0.6465 while the previous day low was 0.6404. The daily 38.2% Fib levels comes at 0.6442, expected to provide resistance. Similarly, the daily 61.8% fib level is at 0.6427, expected to provide resistance.
The AUD/USD pair remains inside the woods above the round-level support of 0.6400. The Aussie asset struggles to find a direction as the US Dollar has turned sideways amid uncertainty over the Federal Reserve’s (Fed) interest rate outlook for the remaining 2023.
The US Dollar Index (DXY) is broadly upbeat amid fears of a slowdown in the global economy. The Chinese economy is facing deflation risks as household demand remains weak due to a rising jobless rate. The Australian Dollar is facing the headwinds of weak China’s economic growth, being a proxy player.
Going forward, the Australian Dollar will dance to the tune of the monthly Consumer Price Index (CPI) data for August, which will be published on Wednesday. The economic data is seen hotter at 5.2% vs. July’s reading of 4.9%. Acceleration in the inflation data could elevate troubles for Reserve Bank of Australia (RBA) policymakers and force them to raise interest rates one more time.
AUD/USD rebounds after discovering buying interest near the horizontal support plotted from August 17 low around 0.6364 on a two-hour scale. While the upside seems restricted near the horizontal resistance placed from August 15 high around 0.6522. The 20-day Exponential Moving Average (EMA), which trades around 0.6340 is overlapping the Aussie asset, indicating a sideways trend.
The Relative Strength Index (RSI) (14) jumps above 60.00, which indicates that the bullish impulse has been triggered.
A decisive break above August 15 high around 0.6522 will drive the asset to August 9 high at 0.6571. Breach of the latter will drive the asset towards August 10 high at 0.6616.
On the flip side, fresh downside would appear if the Aussie asset would drop below August 17 low around 0.6360. This would expose the asset to the round-level support of 0.6300 followed by 03 November 2022 low at 0.6272.
Technical Levels: Supports and Resistances
AUDUSD currently trading at 0.6427 at the time of writing. Pair opened at 0.6441 and is trading with a change of -0.22 % .
| Overview | Overview.1 | |
|---|---|---|
| 0 | Today last price | 0.6427 |
| 1 | Today Daily Change | -0.0014 |
| 2 | Today Daily Change % | -0.2200 |
| 3 | Today daily open | 0.6441 |
The pair remains strongly bearish on the daily time frame. It trades below the 20 SMA @ 0.6432, 50 SMA 0.6523, 100 SMA @ 0.6605 and 200 SMA @ 0.6697.
| Trends | Trends.1 | |
|---|---|---|
| 0 | Daily SMA20 | 0.6432 |
| 1 | Daily SMA50 | 0.6523 |
| 2 | Daily SMA100 | 0.6605 |
| 3 | Daily SMA200 | 0.6697 |
The previous day high was 0.6465 while the previous day low was 0.6404. The daily 38.2% Fib levels comes at 0.6442, expected to provide resistance. Similarly, the daily 61.8% fib level is at 0.6427, expected to provide resistance.
Note the levels of interest below:
- Pivot support is noted at 0.6408, 0.6375, 0.6347
- Pivot resistance is noted at 0.647, 0.6498, 0.6531
| Levels | Levels.1 |
|---|---|
| Previous Daily High | 0.6465 |
| Previous Daily Low | 0.6404 |
| Previous Weekly High | 0.6511 |
| Previous Weekly Low | 0.6385 |
| Previous Monthly High | 0.6724 |
| Previous Monthly Low | 0.6364 |
| Daily Fibonacci 38.2% | 0.6442 |
| Daily Fibonacci 61.8% | 0.6427 |
| Daily Pivot Point S1 | 0.6408 |
| Daily Pivot Point S2 | 0.6375 |
| Daily Pivot Point S3 | 0.6347 |
| Daily Pivot Point R1 | 0.6470 |
| Daily Pivot Point R2 | 0.6498 |
| Daily Pivot Point R3 | 0.6531 |
[/s2If]
Download Nehcap EAWe have two EAs that are operational on our LIVE accounts.
- EA-FIX: Check out the details here. Download EA-FIX . EA-FIX is a non-grid HFT scalper.
- EA-GROWTH: High quality low dd EA using trend grids. Download EA_GROWTHJoin Our Telegram Group


