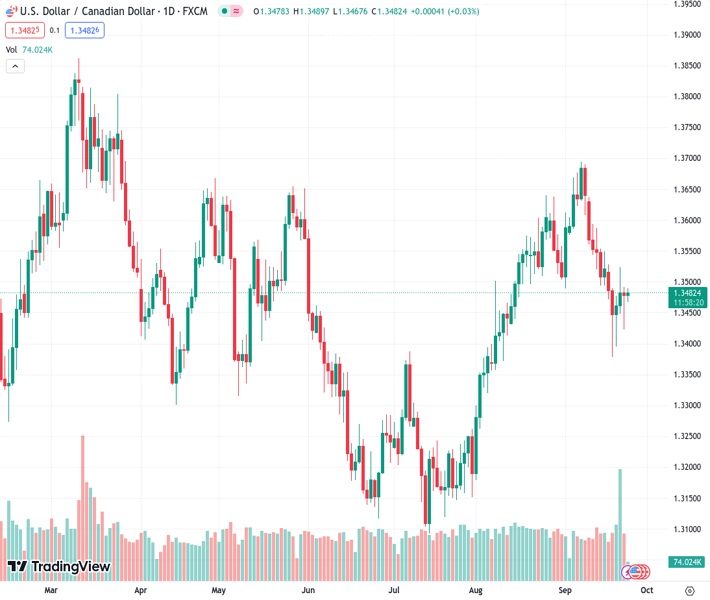
The USDCAD currency pair remains steady at 1.34843 while waiting for the release of economic data from both the United States and Canada.
…
This is a premium post.
[s2If !current_user_can(access_s2member_level4)]Please register for FREE REGISTER to read full post below containing analysis. In case of any error or you think you are not able to read the full post below, please email us at support#nehcap.com [lwa][/s2If] [s2If current_user_can(access_s2member_level1)]
- USD/CAD moves sideways before the economic data releases from both countries.
The pair currently trades last at 1.34843.
The previous day high was 1.3492 while the previous day low was 1.3424. The daily 38.2% Fib levels comes at 1.3466, expected to provide support. Similarly, the daily 61.8% fib level is at 1.345, expected to provide support.
USD/CAD consolidates with a negative bias, trading around 1.3480 during the European session on Monday. The pair is experiencing upward support on the back of upbeat US Treasury yields, which have surged to multi-year highs.
The upbeat US Treasury yields are contributing to the strength of the US Dollar (USD). US 10-year bond yield trades at 4.48%, up by 1.15% by the press time.
US Dollar Index (DXY), which measures the value of the Greenback against six major currencies, is hovering below a six-month high reached on Friday, trading around 105.60 at the time of writing. The DXY’s struggle to gain momentum may be due to market caution ahead of key economic data releases in the United States (US).
Investors will closely monitor the US economic calendar, which includes important data such as Consumer Confidence, Durable Goods Orders, Initial Jobless Claims, and Core Personal Consumption Expenditures (PCE), which is the Fed’s preferred measure of inflation. The annual figure for Core PCE is expected to drop from 4.2% to 3.9%.
These data points will provide insights into the economic situation in the US and influence trading involving the Greenback.
During the previous week, the US Federal Reserve (Fed) conducted its sixth monetary policy meeting. While the Fed chose to keep interest rates unchanged, it made upward revisions to its projections for the Federal Funds Rate (FFR).
For 2023, policymakers now anticipate the FFR to end at 5.60%, and for 2024, they raised their estimates from 4.6% to 5.1%.
Furthermore, comments from Boston Fed President Susan Collins and US Federal Reserve (Fed) Governor Michelle W. Bowman suggest that further interest rate tightening is possible, emphasizing the need for patience and more rate hikes to control inflation. The prospect of rising interest rates could provide support for the USD.
On Canada’s side, Statistics on Friday showed that Canada’s Retail Sales (MoM) for July increased by 0.3%, an improvement from the 0.1% in the previous reading. However, this figure fell slightly below the market consensus of 0.4%.
While Core Retail Sales experienced a more significant rebound, rising by 1.0% swinging from a 0.7% drop in the previous reading. This exceeded market expectations, which were set at 0.5%.
The rally in oil prices is providing support for the Canadian Dollar (CAD), given that Canada is a leading oil exporter to the US. This could potentially limit the upside for the USD/CAD pair. Moreover, traders will likely watch Canada’s Gross Domestic Product (GDP) for July due on Friday.
Technical Levels: Supports and Resistances
USDCAD currently trading at 1.3479 at the time of writing. Pair opened at 1.3484 and is trading with a change of -0.04 % .
| Overview | Overview.1 | |
|---|---|---|
| 0 | Today last price | 1.3479 |
| 1 | Today Daily Change | -0.0005 |
| 2 | Today Daily Change % | -0.0400 |
| 3 | Today daily open | 1.3484 |
The pair is trading below its 20 Daily moving average @ 1.3552, above its 50 Daily moving average @ 1.3441 , above its 100 Daily moving average @ 1.34 and above its 200 Daily moving average @ 1.3462
| Trends | Trends.1 | |
|---|---|---|
| 0 | Daily SMA20 | 1.3552 |
| 1 | Daily SMA50 | 1.3441 |
| 2 | Daily SMA100 | 1.3400 |
| 3 | Daily SMA200 | 1.3462 |
The previous day high was 1.3492 while the previous day low was 1.3424. The daily 38.2% Fib levels comes at 1.3466, expected to provide support. Similarly, the daily 61.8% fib level is at 1.345, expected to provide support.
Note the levels of interest below:
- Pivot support is noted at 1.3441, 1.3398, 1.3373
- Pivot resistance is noted at 1.3509, 1.3534, 1.3577
| Levels | Levels.1 |
|---|---|
| Previous Daily High | 1.3492 |
| Previous Daily Low | 1.3424 |
| Previous Weekly High | 1.3528 |
| Previous Weekly Low | 1.3379 |
| Previous Monthly High | 1.3640 |
| Previous Monthly Low | 1.3184 |
| Daily Fibonacci 38.2% | 1.3466 |
| Daily Fibonacci 61.8% | 1.3450 |
| Daily Pivot Point S1 | 1.3441 |
| Daily Pivot Point S2 | 1.3398 |
| Daily Pivot Point S3 | 1.3373 |
| Daily Pivot Point R1 | 1.3509 |
| Daily Pivot Point R2 | 1.3534 |
| Daily Pivot Point R3 | 1.3577 |
[/s2If]
Download Nehcap EAWe have two EAs that are operational on our LIVE accounts.
- EA-FIX: Check out the details here. Download EA-FIX . EA-FIX is a non-grid HFT scalper.
- EA-GROWTH: High quality low dd EA using trend grids. Download EA_GROWTHJoin Our Telegram Group


