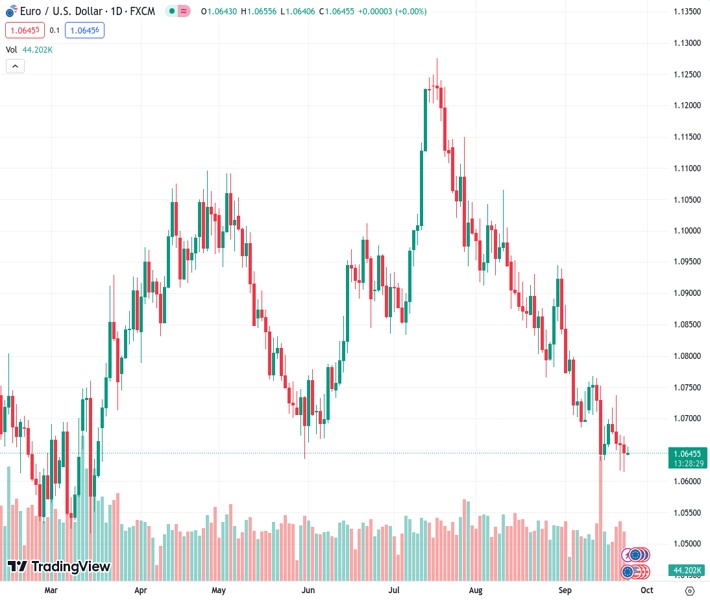
EURUSD is maintaining a small fluctuation around 1.06449 on Monday and appears at risk of declining further.
…
This is a premium post.
[s2If !current_user_can(access_s2member_level4)]Please register for FREE REGISTER to read full post below containing analysis. In case of any error or you think you are not able to read the full post below, please email us at support#nehcap.com [lwa][/s2If] [s2If current_user_can(access_s2member_level1)]
- EUR/USD oscillates in a narrow range on Monday and seems vulnerable to decline further.
The pair currently trades last at 1.06449.
The previous day high was 1.0672 while the previous day low was 1.0615. The daily 38.2% Fib levels comes at 1.0637, expected to provide support. Similarly, the daily 61.8% fib level is at 1.065, expected to provide resistance.
The EUR/USD pair struggles to gain any meaningful traction on the first day of a new week and oscillates in a narrow trading band, around mid-1.0600s through the early European session. Spot prices, meanwhile, remain well within the striking distance of the lowest level since March touched last Friday and seem vulnerable to prolonging the downward trajectory witnessed over the past two months or so.
The US Dollar (USD) stands tall near a six-month peak in the wake of the Federal Reserve’s (Fed) hawkish outlook, which, in turn, is seen as a key factor acting as a headwind for the EUR/USD pair. The Fed last week reiterated that interest rates will remain higher for longer and warned that still-sticky inflation in the US was likely to attract at least one more interest rate hike by the end of this year. Furthermore, policymakers now see just two rate cuts in 2024 as compared to four projected previously, which remains supportive of elevated US Treasury bond yields.
In fact, the rate-sensitive two-year US government bond yield holds steady near its highest level since 2006 and the benchmark 10-year Treasury yield hovers near a 16-year top. This, along with persistent worries about a property market crisis in China, underpins the safe-haven Greenback. The shared currency, on the other hand, is weighed down by the European Central Bank’s (ECB) dovish rate decision last Thursday. This turns out to be another factor that fails to assist the EUR/USD pair to attract buyers or register any meaningful recovery from a multi-month low.
The ECB downgraded its CPI and GDP growth forecasts for 2024 and 2025, suggesting that the 14-month-long policy tightening cycle could have reached its peak already. Furthermore, the Eurozone PMI released on Friday indicated that the struggling manufacturing sector continued to weigh on growth in September and fueled speculations about a possible contraction in GDP during the second half of the year. This, in turn, reaffirms market expectations that further hikes may be off the table for now and supports prospects for a further depreciating move for the EUR/USD pair.
Traders now look to the German Ifo Business Climate for some impetus ahead of ECB President Christine Lagarde’s scheduled speech later during the early North American session. Meanwhile, there isn’t any relevant market-moving economic data due for release from the US on Monday, leaving the USD at the mercy of the US bond yields. Apart from this, the broader risk sentiment might influence the USD price dynamics and contribute to producing short-term trading opportunities around the EUR/USD pair.
Technical Levels: Supports and Resistances
EURUSD currently trading at 1.0652 at the time of writing. Pair opened at 1.0648 and is trading with a change of 0.04 % .
| Overview | Overview.1 | |
|---|---|---|
| 0 | Today last price | 1.0652 |
| 1 | Today Daily Change | 0.0004 |
| 2 | Today Daily Change % | 0.0400 |
| 3 | Today daily open | 1.0648 |
The pair remains strongly bearish on the daily time frame. It trades below the 20 SMA @ 1.0738, 50 SMA 1.0885, 100 SMA @ 1.0877 and 200 SMA @ 1.083.
| Trends | Trends.1 | |
|---|---|---|
| 0 | Daily SMA20 | 1.0738 |
| 1 | Daily SMA50 | 1.0885 |
| 2 | Daily SMA100 | 1.0877 |
| 3 | Daily SMA200 | 1.0830 |
The previous day high was 1.0672 while the previous day low was 1.0615. The daily 38.2% Fib levels comes at 1.0637, expected to provide support. Similarly, the daily 61.8% fib level is at 1.065, expected to provide resistance.
Note the levels of interest below:
- Pivot support is noted at 1.0618, 1.0588, 1.0562
- Pivot resistance is noted at 1.0675, 1.0702, 1.0731
| Levels | Levels.1 |
|---|---|
| Previous Daily High | 1.0672 |
| Previous Daily Low | 1.0615 |
| Previous Weekly High | 1.0737 |
| Previous Weekly Low | 1.0615 |
| Previous Monthly High | 1.1065 |
| Previous Monthly Low | 1.0766 |
| Daily Fibonacci 38.2% | 1.0637 |
| Daily Fibonacci 61.8% | 1.0650 |
| Daily Pivot Point S1 | 1.0618 |
| Daily Pivot Point S2 | 1.0588 |
| Daily Pivot Point S3 | 1.0562 |
| Daily Pivot Point R1 | 1.0675 |
| Daily Pivot Point R2 | 1.0702 |
| Daily Pivot Point R3 | 1.0731 |
[/s2If]
Download Nehcap EAWe have two EAs that are operational on our LIVE accounts.
- EA-FIX: Check out the details here. Download EA-FIX . EA-FIX is a non-grid HFT scalper.
- EA-GROWTH: High quality low dd EA using trend grids. Download EA_GROWTHJoin Our Telegram Group


