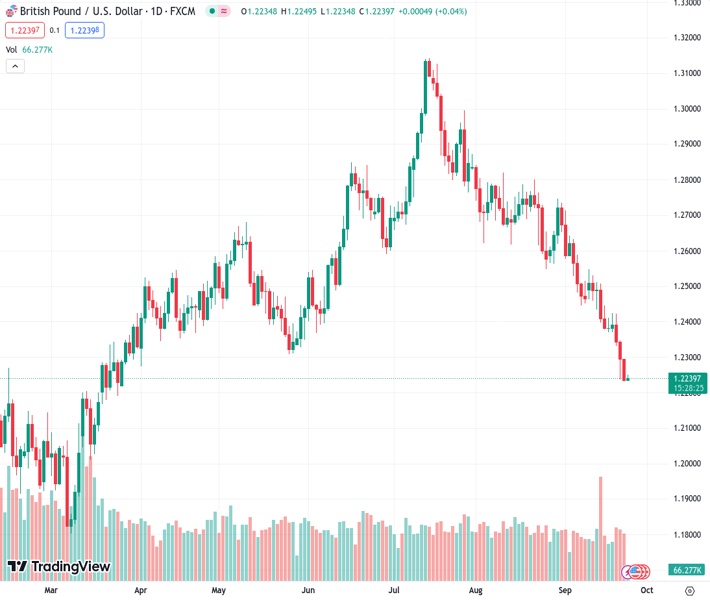
The GBPUSD at a rate of 1.22407 continues to face downward pressure due to the Federal Reserve’s more aggressive position.
…
This is a premium post.
[s2If !current_user_can(access_s2member_level4)]Please register for FREE REGISTER to read full post below containing analysis. In case of any error or you think you are not able to read the full post below, please email us at support#nehcap.com [lwa][/s2If] [s2If current_user_can(access_s2member_level1)]
- GBP/USD remains under selling pressure amid the Fed’s hawkish stance.
The pair currently trades last at 1.22407.
The previous day high was 1.2302 while the previous day low was 1.2231. The daily 38.2% Fib levels comes at 1.2258, expected to provide resistance. Similarly, the daily 61.8% fib level is at 1.2275, expected to provide resistance.
The GBP/USD pair remains on the defensive below the mid-1.2200s during the Asian session on Monday. Market players await the release of the UK’s Gross Domestic Product (GDP) for the second quarter and the US highly-anticipated Core Personal Consumption Expenditure (PCE) Price Index data due on Friday. The major pair currently trades near 1.2242, gaining 0.02% on the day.
That said, the hawkish stance from the Federal Reserve (Fed) officials lifted the US Dollar (USD) against the British Pound (GBP). Fed Banks of Boston and San Francisco Presidents, Susan Collins and Mary Daly, emphasized that although inflation is cooling down, additional rate hikes would be necessary. This, in turn, might act as a headwind for the GBP/USD pair
According to the four-hour chart, GBP/USD holds below the 50- and 100-hour Exponential Moving Averages (EMAs) with a downward slope, which means further downside looks favorable. The Relative Strength Index (RSI) holds in bearish territory below 50. However, the oversold condition indicates that further consolidation cannot be ruled out before positioning for any near-term GBP/USD depreciation.
That said, the immediate resistance level for GBP/USD will emerge near the middle line of the Bollinger Band at 1.2290. The additional upside filter is located at 1.2354, representing the 50-hour EMA. The upper boundary of the Bollinger Band at 1.2383 will be the next barrier for the pair, en route to 1.2432 (the 100-hour EMA).
On the flip side, the lower limit of the Bollinger Band at 1.2200 will be the critical support level. Further south, the next stop of GBP/USD is located at 1.2178 (a low of March 28). Any intraday pullback below the latter would expose the next downside stop at 1.2128 (a high of March 16) and finally at 1.2100 (a low of March 17).
Technical Levels: Supports and Resistances
GBPUSD currently trading at 1.2242 at the time of writing. Pair opened at 1.224 and is trading with a change of 0.02 % .
| Overview | Overview.1 | |
|---|---|---|
| 0 | Today last price | 1.2242 |
| 1 | Today Daily Change | 0.0002 |
| 2 | Today Daily Change % | 0.0200 |
| 3 | Today daily open | 1.2240 |
The pair remains strongly bearish on the daily time frame. It trades below the 20 SMA @ 1.249, 50 SMA 1.2666, 100 SMA @ 1.2643 and 200 SMA @ 1.2434.
| Trends | Trends.1 | |
|---|---|---|
| 0 | Daily SMA20 | 1.2490 |
| 1 | Daily SMA50 | 1.2666 |
| 2 | Daily SMA100 | 1.2643 |
| 3 | Daily SMA200 | 1.2434 |
The previous day high was 1.2302 while the previous day low was 1.2231. The daily 38.2% Fib levels comes at 1.2258, expected to provide resistance. Similarly, the daily 61.8% fib level is at 1.2275, expected to provide resistance.
Note the levels of interest below:
- Pivot support is noted at 1.2213, 1.2187, 1.2143
- Pivot resistance is noted at 1.2284, 1.2328, 1.2355
| Levels | Levels.1 |
|---|---|
| Previous Daily High | 1.2302 |
| Previous Daily Low | 1.2231 |
| Previous Weekly High | 1.2425 |
| Previous Weekly Low | 1.2231 |
| Previous Monthly High | 1.2841 |
| Previous Monthly Low | 1.2548 |
| Daily Fibonacci 38.2% | 1.2258 |
| Daily Fibonacci 61.8% | 1.2275 |
| Daily Pivot Point S1 | 1.2213 |
| Daily Pivot Point S2 | 1.2187 |
| Daily Pivot Point S3 | 1.2143 |
| Daily Pivot Point R1 | 1.2284 |
| Daily Pivot Point R2 | 1.2328 |
| Daily Pivot Point R3 | 1.2355 |
[/s2If]
Download Nehcap EAWe have two EAs that are operational on our LIVE accounts.
- EA-FIX: Check out the details here. Download EA-FIX . EA-FIX is a non-grid HFT scalper.
- EA-GROWTH: High quality low dd EA using trend grids. Download EA_GROWTHJoin Our Telegram Group


