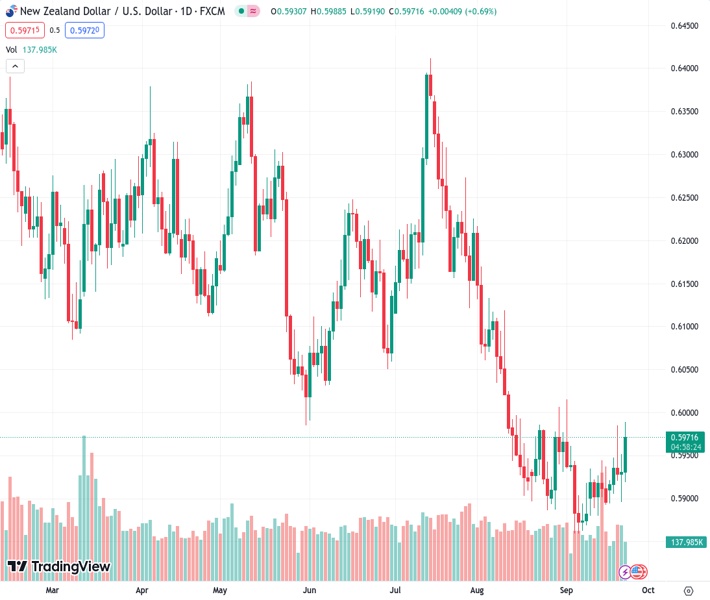
Due to a renewed interest in taking risks and a weaker US Dollar, the currency pair NZDUSD has experienced a recovery from its lowest point of the day, rising from 0.5919 to 0.5977.
…
This is a premium post.
[s2If !current_user_can(access_s2member_level4)]Please register for FREE REGISTER to read full post below containing analysis. In case of any error or you think you are not able to read the full post below, please email us at support#nehcap.com [lwa][/s2If] [s2If current_user_can(access_s2member_level1)]
- NZD/USD rebounds from a daily low of 0.5919 to 0.5977, driven by improved risk appetite and a softer US Dollar.
The pair currently trades last at 0.59739.
The previous day high was 0.5955 while the previous day low was 0.5896. The daily 38.2% Fib levels comes at 0.5932, expected to provide support. Similarly, the daily 61.8% fib level is at 0.5918, expected to provide support.
The New Zealand Dollar (NZD) stages a recovery against the US Dollar (USD) ahead of the weekend as investors’ sentiment improved, while the Greenback is trading soft, undermined by a fall in US Treasury bond yields. The NZD/USD is trading at 0.5977 after bouncing from a daily low of 0.5919.
Wall Street is trading in the green due to improved risk appetite. A report from S&P Global showed that business activity in the United States (US) was almost unchanged in September. The S&P Global Manufacturing PMI improved to 48.9 from 47.9 a month earlier, exceeding estimates but remained in contractionary territory, while the Services PMI dipped to 50.2 from 50.5 in July, below forecasts. The Composite reading, which offers a general view of business activity, was aligned with estimates at 50.1 but trailed August’s 50.2
Aside from this, US central bank officials had been unleashed, with Boston Fed President Susan Collins saying that further tightening is possible, though “patience” is required. Echoing some of her comments was Fed’s Governor Michell Bowman, who was more determined, saying that more rate hikes are needed to control inflation.
Although Fed officials’ comments were hawkish, the Greenback failed to gain traction. The US Dollar Index (DXY), which measures the buck’s value against its peers, climbs just 0.09%, at 105.47, after dropping from 10578 high. US Treasury bond yields continued to weaken across the short and long end of the curve.
On the New Zealand (NZ) front, data revealed on Friday’s session that consumer confidence weakened in the third quarter regarding the economic outlook, with the index falling to 80.2 from 83.1. The agenda revealed the Trade Balance showed an improvement in the annual trade deficit to $15.54B for August $-1588B from prior figures.
For the next week, the economic agenda in the US would feature the Conference Board (CB) Consumer Confidence, Durable Good Orders, Initial Jobless Claims, and the Fed’s preferred gauge for inflation, the Core PCE. The docket would feature the Business and Consumer Confidence on the NZ front.
The pair bottomed out at around 0.5859, and since then, the NZD/USD has staged a comeback despite recent US Dollar strength. During the last three days, the currency pair has remained volatile, unable to get a clear direction, though it remains slightly tilted to the downside. However, further upside is expected if buyers lift the exchange rate past the September 1 swing high at 0.6015. Conversely, sellers must reclaim the September 21 low of 0.5895.
Technical Levels: Supports and Resistances
NZDUSD currently trading at 0.5975 at the time of writing. Pair opened at 0.5931 and is trading with a change of 0.74 % .
| Overview | Overview.1 | |
|---|---|---|
| 0 | Today last price | 0.5975 |
| 1 | Today Daily Change | 0.0044 |
| 2 | Today Daily Change % | 0.7400 |
| 3 | Today daily open | 0.5931 |
The pair is trading above its 20 Daily moving average @ 0.5919, below its 50 Daily moving average @ 0.6026 , below its 100 Daily moving average @ 0.61 and below its 200 Daily moving average @ 0.619
| Trends | Trends.1 | |
|---|---|---|
| 0 | Daily SMA20 | 0.5919 |
| 1 | Daily SMA50 | 0.6026 |
| 2 | Daily SMA100 | 0.6100 |
| 3 | Daily SMA200 | 0.6190 |
The previous day high was 0.5955 while the previous day low was 0.5896. The daily 38.2% Fib levels comes at 0.5932, expected to provide support. Similarly, the daily 61.8% fib level is at 0.5918, expected to provide support.
Note the levels of interest below:
- Pivot support is noted at 0.59, 0.5868, 0.584
- Pivot resistance is noted at 0.5959, 0.5986, 0.6018
| Levels | Levels.1 |
|---|---|
| Previous Daily High | 0.5955 |
| Previous Daily Low | 0.5896 |
| Previous Weekly High | 0.5945 |
| Previous Weekly Low | 0.5880 |
| Previous Monthly High | 0.6219 |
| Previous Monthly Low | 0.5885 |
| Daily Fibonacci 38.2% | 0.5932 |
| Daily Fibonacci 61.8% | 0.5918 |
| Daily Pivot Point S1 | 0.5900 |
| Daily Pivot Point S2 | 0.5868 |
| Daily Pivot Point S3 | 0.5840 |
| Daily Pivot Point R1 | 0.5959 |
| Daily Pivot Point R2 | 0.5986 |
| Daily Pivot Point R3 | 0.6018 |
[/s2If]
Download Nehcap EAWe have two EAs that are operational on our LIVE accounts.
- EA-FIX: Check out the details here. Download EA-FIX . EA-FIX is a non-grid HFT scalper.
- EA-GROWTH: High quality low dd EA using trend grids. Download EA_GROWTHJoin Our Telegram Group


