The USDCAD is experiencing a period of relatively stable trading as it awaits the release of economic data from both the United States and Canada.
…
This is a premium post.
[s2If !current_user_can(access_s2member_level4)]Please register for FREE REGISTER to read full post below containing analysis. In case of any error or you think you are not able to read the full post below, please email us at support#nehcap.com [lwa][/s2If] [s2If current_user_can(access_s2member_level1)]
- USD/CAD trades sideways ahead of economic data from both economies.
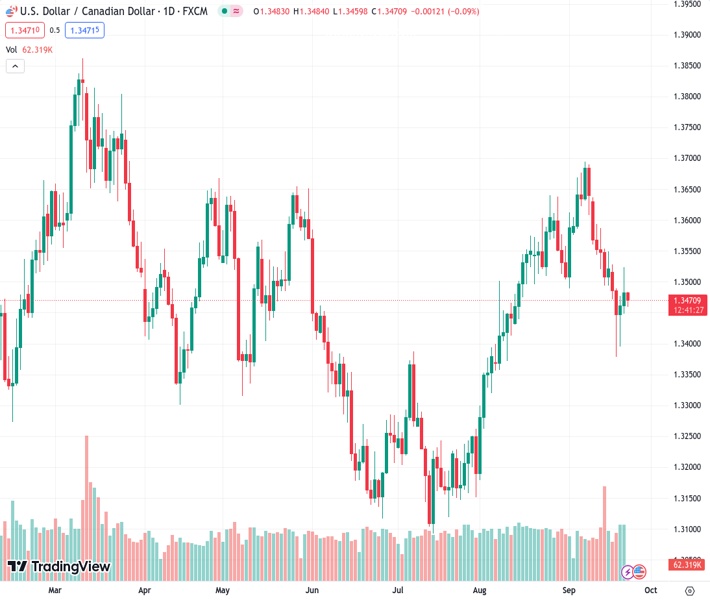
The pair currently trades last at 1.34716.
The previous day high was 1.3524 while the previous day low was 1.3453. The daily 38.2% Fib levels comes at 1.3497, expected to provide resistance. Similarly, the daily 61.8% fib level is at 1.348, expected to provide resistance.
USD/CAD halts a two-day winning streak, trading sideways near 1.3470 during the European session on Friday. The pair experienced downward pressure as the US Dollar (USD) trimmed a part of intraday gains, coupled with the upbeat Crude oil prices.
The pullback in US Treasury yields might have put a ceiling on the gains of the US Dollar (USD). The yield on the 10-year US bond stands at 4.46% at the time of writing.
US Dollar Index (DXY), which measures the performance of the Greenback against the six other major currencies, is trading at around 105.50 by the press time.
West Texas Intermediate (WTI), the crude oil prices trade around $89.90 per barrel at the time of writing. This upward trend is attributed to the deliberate production cutbacks by OPEC+ producers.
These producers are actively reducing the supply of crude oil in the market as part of their efforts to support oil prices and balance the global supply-demand dynamics.
Market participants await economic data releases due on Friday, including the preliminary US S&P Global PMIs for September and Canada’s Retail Sales for July. These figures have the potential to provide valuable insights into the economic conditions of both economies and can aid traders in identifying potential trading opportunities around the USD/CAD pair
Fed maintained interest rates within the 5.25-5.50% range during its Wednesday meeting. Fed Chairman Jerome Powell, during a subsequent press conference, reiterated the Fed’s commitment to achieving a 2% inflation target. Powell also mentioned that the Fed is prepared to raise rates if deemed necessary. The Fed’s hawkish sentiment could help in underpinning the US Dollar (USD).
Technical Levels: Supports and Resistances
USDCAD currently trading at 1.3471 at the time of writing. Pair opened at 1.3484 and is trading with a change of -0.1 % .
| Overview | Overview.1 | |
|---|---|---|
| 0 | Today last price | 1.3471 |
| 1 | Today Daily Change | -0.0013 |
| 2 | Today Daily Change % | -0.1000 |
| 3 | Today daily open | 1.3484 |
The pair is trading below its 20 Daily moving average @ 1.3558, above its 50 Daily moving average @ 1.3436 , above its 100 Daily moving average @ 1.3398 and above its 200 Daily moving average @ 1.3463
| Trends | Trends.1 | |
|---|---|---|
| 0 | Daily SMA20 | 1.3558 |
| 1 | Daily SMA50 | 1.3436 |
| 2 | Daily SMA100 | 1.3398 |
| 3 | Daily SMA200 | 1.3463 |
The previous day high was 1.3524 while the previous day low was 1.3453. The daily 38.2% Fib levels comes at 1.3497, expected to provide resistance. Similarly, the daily 61.8% fib level is at 1.348, expected to provide resistance.
Note the levels of interest below:
- Pivot support is noted at 1.345, 1.3416, 1.3379
- Pivot resistance is noted at 1.352, 1.3558, 1.3591
| Levels | Levels.1 |
|---|---|
| Previous Daily High | 1.3524 |
| Previous Daily Low | 1.3453 |
| Previous Weekly High | 1.3639 |
| Previous Weekly Low | 1.3493 |
| Previous Monthly High | 1.3640 |
| Previous Monthly Low | 1.3184 |
| Daily Fibonacci 38.2% | 1.3497 |
| Daily Fibonacci 61.8% | 1.3480 |
| Daily Pivot Point S1 | 1.3450 |
| Daily Pivot Point S2 | 1.3416 |
| Daily Pivot Point S3 | 1.3379 |
| Daily Pivot Point R1 | 1.3520 |
| Daily Pivot Point R2 | 1.3558 |
| Daily Pivot Point R3 | 1.3591 |
[/s2If]
Download Nehcap EAWe have two EAs that are operational on our LIVE accounts.
- EA-FIX: Check out the details here. Download EA-FIX . EA-FIX is a non-grid HFT scalper.
- EA-GROWTH: High quality low dd EA using trend grids. Download EA_GROWTHJoin Our Telegram Group


