The USD to INR exchange rate declines to its lowest level in several weeks on Friday, but there is a lack of sustained selling pressure.
…
This is a premium post.
[s2If !current_user_can(access_s2member_level4)]Please register for FREE REGISTER to read full post below containing analysis. In case of any error or you think you are not able to read the full post below, please email us at support#nehcap.com [lwa][/s2If] [s2If current_user_can(access_s2member_level1)]
- USD/INR drops to a multi-week low on Friday, though lacks follow-through selling.
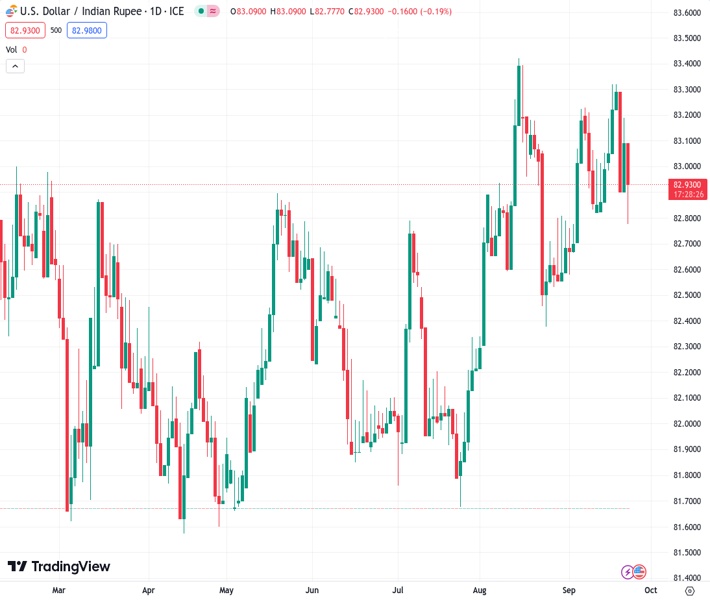
The pair currently trades last at 82.9480.
The previous day high was 83.2397 while the previous day low was 82.925. The daily 38.2% Fib levels comes at 83.1195, expected to provide resistance. Similarly, the daily 61.8% fib level is at 83.0452, expected to provide resistance.
The USD/INR pair comes under some renewed selling pressure on Friday and touches a nearly three-week low, around the 82.80-82.75 region during the Asian session. Spot prices, however, manage to trim a part of the intraday losses and currently trade just below the 83.00 round figure, still down over 0.20% for the day.
Technical indicators on the daily chart, meanwhile, have just started drifting in the negative territory and support prospects for some meaningful depreciating move. That said, any subsequent decline below the daily trough is likely to find decent support near the 100-day Simple Moving Average (SMA), currently pegged near the 82.45 region. This is closely followed by the 200-day SMA, around the 82.35 zone, which should now act as a key pivotal point for the USD/INR pair.
The latter near the August 24 low, which if broken decisive will be seen as a fresh trigger for bearish traders and prompt aggressive technical selling. Spot prices might then turn vulnerable to accelerate the slide towards the 82.00 mark. The downward trajectory could get extended and eventually drag the USD/INR pair to the July swing low, around the 81.70-81.65 region.
On the flip side, movement above the 83.00-83.05 immediate hurdle now seems to confront resistance near the 82.30 zone ahead of the all-time peak, around the 83.40-83.45 region touched on August 15. A sustained strength beyond will be seen as a fresh trigger for bullish traders and allow the USD/INR pair to conquer the 84.00 round-figure mark.
Technical Levels: Supports and Resistances
USDINR currently trading at 82.9572 at the time of writing. Pair opened at 83.1234 and is trading with a change of -0.2 % .
| Overview | Overview.1 | |
|---|---|---|
| 0 | Today last price | 82.9572 |
| 1 | Today Daily Change | -0.1662 |
| 2 | Today Daily Change % | -0.2000 |
| 3 | Today daily open | 83.1234 |
The pair is trading below its 20 Daily moving average @ 82.9648, above its 50 Daily moving average @ 82.7428 , above its 100 Daily moving average @ 82.5198 and above its 200 Daily moving average @ 82.3593
| Trends | Trends.1 | |
|---|---|---|
| 0 | Daily SMA20 | 82.9648 |
| 1 | Daily SMA50 | 82.7428 |
| 2 | Daily SMA100 | 82.5198 |
| 3 | Daily SMA200 | 82.3593 |
The previous day high was 83.2397 while the previous day low was 82.925. The daily 38.2% Fib levels comes at 83.1195, expected to provide resistance. Similarly, the daily 61.8% fib level is at 83.0452, expected to provide resistance.
Note the levels of interest below:
- Pivot support is noted at 82.9523, 82.7813, 82.6376
- Pivot resistance is noted at 83.267, 83.4107, 83.5817
| Levels | Levels.1 |
|---|---|
| Previous Daily High | 83.2397 |
| Previous Daily Low | 82.9250 |
| Previous Weekly High | 83.2896 |
| Previous Weekly Low | 82.5035 |
| Previous Monthly High | 83.5505 |
| Previous Monthly Low | 82.2240 |
| Daily Fibonacci 38.2% | 83.1195 |
| Daily Fibonacci 61.8% | 83.0452 |
| Daily Pivot Point S1 | 82.9523 |
| Daily Pivot Point S2 | 82.7813 |
| Daily Pivot Point S3 | 82.6376 |
| Daily Pivot Point R1 | 83.2670 |
| Daily Pivot Point R2 | 83.4107 |
| Daily Pivot Point R3 | 83.5817 |
[/s2If]
Download Nehcap EAWe have two EAs that are operational on our LIVE accounts.
- EA-FIX: Check out the details here. Download EA-FIX . EA-FIX is a non-grid HFT scalper.
- EA-GROWTH: High quality low dd EA using trend grids. Download EA_GROWTHJoin Our Telegram Group


