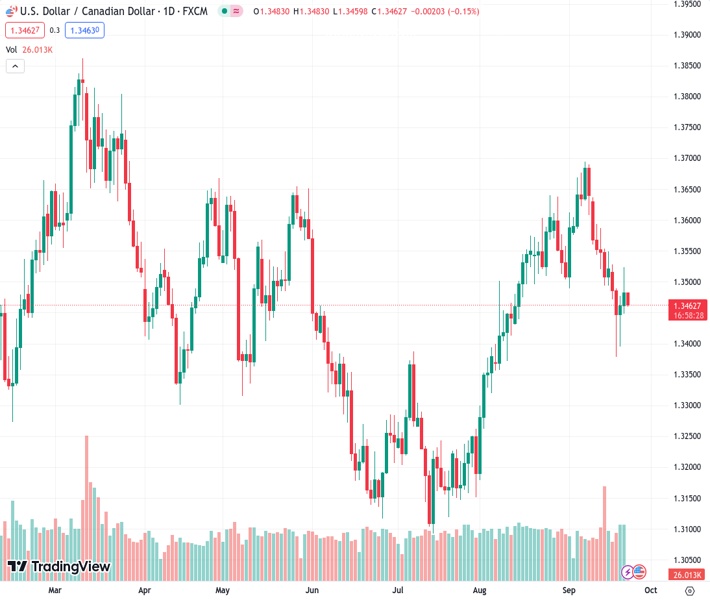
The USDCAD currency pair experienced a decline in momentum at the 1.3460 level on Friday.
…
This is a premium post.
[s2If !current_user_can(access_s2member_level4)]Please register for FREE REGISTER to read full post below containing analysis. In case of any error or you think you are not able to read the full post below, please email us at support#nehcap.com [lwa][/s2If] [s2If current_user_can(access_s2member_level1)]
- USD/CAD loses traction around 1.3460 on Friday.
The pair currently trades last at 1.34636.
The previous day high was 1.3524 while the previous day low was 1.3453. The daily 38.2% Fib levels comes at 1.3497, expected to provide resistance. Similarly, the daily 61.8% fib level is at 1.348, expected to provide resistance.
The USD/CAD pair snaps its two-day winning streak and edges lower to 1.3460 during the Asian session on Friday. A rebound in oil prices underpins the commodity-linked Loonie as the country is the leading oil exporter to the United States. Market players await the monthly Canadian Retail Sales for July and the US S&P Global/CIPS PMI data due later on Friday’s North American session.
According to the one-hour chart, USD/CAD holds below the 50- and 100-hour Exponential Moving Averages (EMAs), which supports the sellers for the time being. Meanwhile, the Relative Strength Index (RSI) stands below 50, activating the bearish momentum for the USD/CAD pair.
The immediate resistance level for the pair is seen near the 100-hour EMA at 1.3480. The additional upside filter to watch is near the confluence of the the upper boundary of the Bollinger Band and a high of September 21 at the 1.3515-1.3525 region. Any follow-through buying above the latter will pave the way to a high of September 13 at 1.3586, followed by a psychological round figure at 1.3600.
On the flip side, a break below the lower limit of Bollinger Band of 1.3455 will see a drop to a key contention at 1.3400. The mentioned level represents a psychological figure and a low of August 11. Further south, the next downside stop will emerge at 1.3380 (a low of September 19).
Technical Levels: Supports and Resistances
USDCAD currently trading at 1.3463 at the time of writing. Pair opened at 1.3484 and is trading with a change of -0.16 % .
| Overview | Overview.1 | |
|---|---|---|
| 0 | Today last price | 1.3463 |
| 1 | Today Daily Change | -0.0021 |
| 2 | Today Daily Change % | -0.1600 |
| 3 | Today daily open | 1.3484 |
The pair is trading below its 20 Daily moving average @ 1.3558, above its 50 Daily moving average @ 1.3436 , above its 100 Daily moving average @ 1.3398 and below its 200 Daily moving average @ 1.3463
| Trends | Trends.1 | |
|---|---|---|
| 0 | Daily SMA20 | 1.3558 |
| 1 | Daily SMA50 | 1.3436 |
| 2 | Daily SMA100 | 1.3398 |
| 3 | Daily SMA200 | 1.3463 |
The previous day high was 1.3524 while the previous day low was 1.3453. The daily 38.2% Fib levels comes at 1.3497, expected to provide resistance. Similarly, the daily 61.8% fib level is at 1.348, expected to provide resistance.
Note the levels of interest below:
- Pivot support is noted at 1.345, 1.3416, 1.3379
- Pivot resistance is noted at 1.352, 1.3558, 1.3591
| Levels | Levels.1 |
|---|---|
| Previous Daily High | 1.3524 |
| Previous Daily Low | 1.3453 |
| Previous Weekly High | 1.3639 |
| Previous Weekly Low | 1.3493 |
| Previous Monthly High | 1.3640 |
| Previous Monthly Low | 1.3184 |
| Daily Fibonacci 38.2% | 1.3497 |
| Daily Fibonacci 61.8% | 1.3480 |
| Daily Pivot Point S1 | 1.3450 |
| Daily Pivot Point S2 | 1.3416 |
| Daily Pivot Point S3 | 1.3379 |
| Daily Pivot Point R1 | 1.3520 |
| Daily Pivot Point R2 | 1.3558 |
| Daily Pivot Point R3 | 1.3591 |
[/s2If]
Download Nehcap EAWe have two EAs that are operational on our LIVE accounts.
- EA-FIX: Check out the details here. Download EA-FIX . EA-FIX is a non-grid HFT scalper.
- EA-GROWTH: High quality low dd EA using trend grids. Download EA_GROWTHJoin Our Telegram Group


