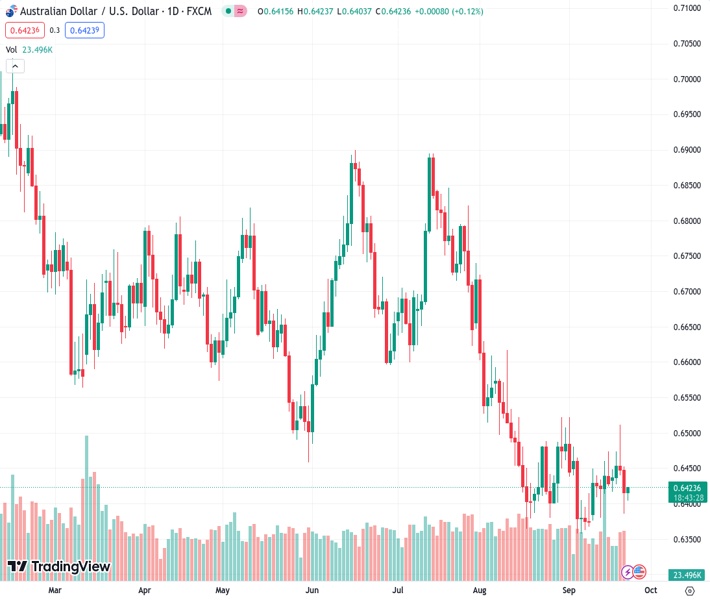
The AUDUSD pair, trading at a price of 0.64227, is showing no clear direction in the short term and is moving within a narrow range during Friday’s trading session.
…
This is a premium post.
[s2If !current_user_can(access_s2member_level4)]Please register for FREE REGISTER to read full post below containing analysis. In case of any error or you think you are not able to read the full post below, please email us at support#nehcap.com [lwa][/s2If] [s2If current_user_can(access_s2member_level1)]
- AUD/USD lacks any firm intraday direction and oscillates in a narrow trading band on Friday.
The pair currently trades last at 0.64227.
The previous day high was 0.6461 while the previous day low was 0.6385. The daily 38.2% Fib levels comes at 0.6414, expected to provide support. Similarly, the daily 61.8% fib level is at 0.6432, expected to provide resistance.
The AUD/USD pair struggles to build on the previous day’s bounce from the 0.6385 region, or over a one-week low, and seesaws between tepid gains/minor losses through the Asian session on Friday. Spot prices currently trade just above the 0.6400 mark, though the fundamental backdrop supports prospects for a further near-term depreciating move.
A survey showed that business activity in Australia’s private sector returned to growth in September after two straight months of contraction and offers some support to the AUD/USD pair. The Judo Bank Flash Australia Composite PMI improved from 48.0 in August to 50.2 during the reported month. Adding to this, Australian Services PMI climbed to a four-month high and came in at 50.5 for September, up from 47.8 in August. The Manufacturing PMI, however, remained in contraction territory and declined to 48.2 from 49.6 in the previous month, holding back bulls from placing aggressive bullish bets around the Aussie.
Furthermore, the underlying bullish sentiment surrounding the US Dollar (USD), bolstered by the Federal Reserve’s (Fed) hawkish outlook, contributes to keeping a lid on any meaningful upside for the AUD/USD pair. The Fed on Wednesday decided to keep rates unchanged at a 22-year high, between the 5.25%-5.50% range, as expected. In the accompanying policy statement, the Fed signalled the possibility of at least one more rate hike by the end of this year in the wake of sticky inflation. Adding to this, policymakers see the benchmark rate at 5.1% next year, suggesting just two rate cuts in 2024 as compared to four projected previously.
The outlook, along with an unexpected drop in the US Weekly Jobless Claims, continues to push the US Treasury bond yields higher. In fact, the yield on the rate-sensitive two-year US government bond touches a fresh 17-year peak, while the 10-year US Treasury yield climbs to the highest since November 2007 and continues to underpin the Greenback. Meanwhile, the Fed’s higher-for-longer narrative fuels concerns about economic headwinds stemming from rapidly rising borrowing costs. This, in turn, is seen weighing on investors’ sentiment, which further benefits the safe-haven buck and undermines the risk-sensitive Australian Dollar.
Traders now look forward to the release of the flash US PMI prints, due later during the early North American session. This, along with the US bond yields and the broader risk sentiment, will influence the USD price dynamics and provide some impetus to the AUD/USD pair. Nevertheless, spot prices seem poised to register modest weekly losses and remain well within the striking distance of the lowest level since November 2022, around the 0.6355 region touched last week.
Technical Levels: Supports and Resistances
AUDUSD currently trading at 0.6413 at the time of writing. Pair opened at 0.6416 and is trading with a change of -0.05 % .
| Overview | Overview.1 | |
|---|---|---|
| 0 | Today last price | 0.6413 |
| 1 | Today Daily Change | -0.0003 |
| 2 | Today Daily Change % | -0.0500 |
| 3 | Today daily open | 0.6416 |
The pair remains strongly bearish on the daily time frame. It trades below the 20 SMA @ 0.643, 50 SMA 0.6531, 100 SMA @ 0.6608 and 200 SMA @ 0.6698.
| Trends | Trends.1 | |
|---|---|---|
| 0 | Daily SMA20 | 0.6430 |
| 1 | Daily SMA50 | 0.6531 |
| 2 | Daily SMA100 | 0.6608 |
| 3 | Daily SMA200 | 0.6698 |
The previous day high was 0.6461 while the previous day low was 0.6385. The daily 38.2% Fib levels comes at 0.6414, expected to provide support. Similarly, the daily 61.8% fib level is at 0.6432, expected to provide resistance.
Note the levels of interest below:
- Pivot support is noted at 0.638, 0.6345, 0.6305
- Pivot resistance is noted at 0.6456, 0.6497, 0.6532
| Levels | Levels.1 |
|---|---|
| Previous Daily High | 0.6461 |
| Previous Daily Low | 0.6385 |
| Previous Weekly High | 0.6474 |
| Previous Weekly Low | 0.6378 |
| Previous Monthly High | 0.6724 |
| Previous Monthly Low | 0.6364 |
| Daily Fibonacci 38.2% | 0.6414 |
| Daily Fibonacci 61.8% | 0.6432 |
| Daily Pivot Point S1 | 0.6380 |
| Daily Pivot Point S2 | 0.6345 |
| Daily Pivot Point S3 | 0.6305 |
| Daily Pivot Point R1 | 0.6456 |
| Daily Pivot Point R2 | 0.6497 |
| Daily Pivot Point R3 | 0.6532 |
[/s2If]
Download Nehcap EAWe have two EAs that are operational on our LIVE accounts.
- EA-FIX: Check out the details here. Download EA-FIX . EA-FIX is a non-grid HFT scalper.
- EA-GROWTH: High quality low dd EA using trend grids. Download EA_GROWTHJoin Our Telegram Group


