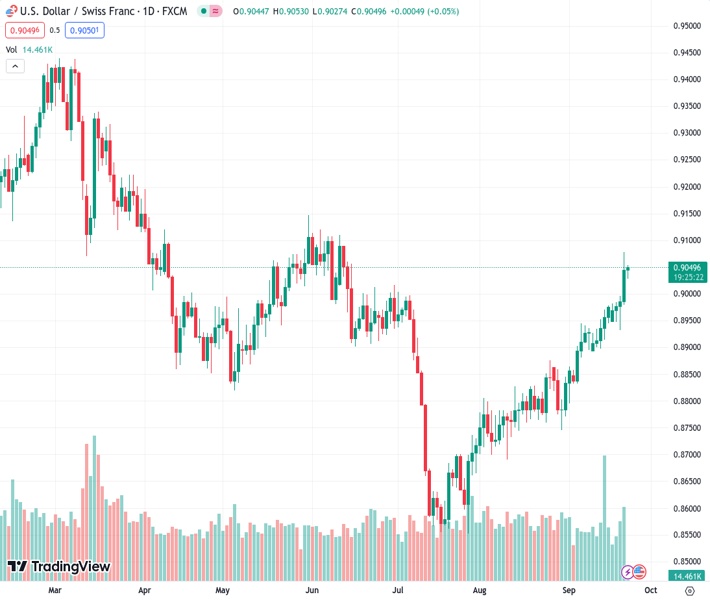
The USDCHF pair, currently at 0.90476, experiences a rebound in a positive direction on Friday and is trading slightly below its highest level in several months.
…
This is a premium post.
[s2If !current_user_can(access_s2member_level4)]Please register for FREE REGISTER to read full post below containing analysis. In case of any error or you think you are not able to read the full post below, please email us at support#nehcap.com [lwa][/s2If] [s2If current_user_can(access_s2member_level1)]
- USD/CHF regains positive traction on Friday and trades just below a multi-month high.
The pair currently trades last at 0.90476.
The previous day high was 0.9078 while the previous day low was 0.8983. The daily 38.2% Fib levels comes at 0.9042, expected to provide support. Similarly, the daily 61.8% fib level is at 0.9019, expected to provide support.
The USD/CHF pair attracts some dip-buying during the Asian session on Friday and looks to build on the previous day’s breakout momentum beyond the 0.9000 psychological mark. Spot prices currently trade around mid-0.9900s and remain well within the striking distance of the highest level since June 13 touched in the aftermath of the Swiss National Bank’s (SNB) unexpected pause on Thursday.
The SNB ended its streak of five consecutive increases and decided to keep its benchmark interest rate unchanged at the end of the quarterly monetary policy meeting as against expectations for a 25 bps lift-off. In the accompanying statement, the SNB noted that the significant tightening of monetary policy over recent quarters is countering remaining inflationary pressure. This comes on top of the recent slew of weak real economy data, and sub-2% readings on the headline and core inflation, which, in turn, weighed heavily on the Swiss Franc (CHF) and provided a goodish boost to the USD/CHF pair.
The US Dollar (USD), on the other hand, holds steady just below a fresh six-month high touched the previous day in the wake of the Federal Reserve’s (Fed) hawkish outlook and is seen as another factor acting as a tailwind for the USD/CHF pair. The Fed decided to keep rates unchanged at a 22-year high, between the 5.25%-5.50% range, though warned that sticky inflation was likely to attract at least one more interest rate hike in 2023. Furthermore, the so-called ‘dot-lot’ indicated that policymakers see the benchmark rate at 5.1% next year, suggesting just two rate cuts in 2024 as compared to four projected previously.
This reaffirmed market expectations that the US central bank will keep interest rates higher for longer. Furthermore, an unexpected drop in the US Weekly Jobless Claims triggered a fresh round of a sell-off in the US fixed-income market and pushed the yield on the rate-sensitive two-year US government bond to a fresh 17-year peak. The 10-year US Treasury yield also climbed to the highest since November 2007 and continues to underpin the Greenback. That said, a generally weaker tone around the equity markets could benefit the safe-haven CHF and keep a lid on any meaningful intraday move up for the USD/CHF pair.
Nevertheless, the aforementioned fundamental backdrop seems tilted firmly in favour of bullish traders. Moreover, the overnight breakout through a technically significant 200-day Simple Moving Average (SMA) validates the positive outlook and suggests that the path of least resistance for the USD/CHF pair is to the upside. Market participants now look forward to the global flash PMI prints, which might influence the broader risk sentiment and provide some impetus to the major. Spot prices, meanwhile, remain on track to end in the green for the tenth successive week.
Technical Levels: Supports and Resistances
USDCHF currently trading at 0.9051 at the time of writing. Pair opened at 0.9045 and is trading with a change of 0.07 % .
| Overview | Overview.1 | |
|---|---|---|
| 0 | Today last price | 0.9051 |
| 1 | Today Daily Change | 0.0006 |
| 2 | Today Daily Change % | 0.0700 |
| 3 | Today daily open | 0.9045 |
The pair remains strongly bullish on the daily timeframe. It trades above its 20 SMA @ 0.8906, 50 SMA 0.8797, 100 SMA @ 0.8884 and 200 SMA @ 0.9036.
| Trends | Trends.1 | |
|---|---|---|
| 0 | Daily SMA20 | 0.8906 |
| 1 | Daily SMA50 | 0.8797 |
| 2 | Daily SMA100 | 0.8884 |
| 3 | Daily SMA200 | 0.9036 |
The previous day high was 0.9078 while the previous day low was 0.8983. The daily 38.2% Fib levels comes at 0.9042, expected to provide support. Similarly, the daily 61.8% fib level is at 0.9019, expected to provide support.
Note the levels of interest below:
- Pivot support is noted at 0.8992, 0.894, 0.8897
- Pivot resistance is noted at 0.9088, 0.9131, 0.9184
| Levels | Levels.1 |
|---|---|
| Previous Daily High | 0.9078 |
| Previous Daily Low | 0.8983 |
| Previous Weekly High | 0.8978 |
| Previous Weekly Low | 0.8897 |
| Previous Monthly High | 0.8876 |
| Previous Monthly Low | 0.8690 |
| Daily Fibonacci 38.2% | 0.9042 |
| Daily Fibonacci 61.8% | 0.9019 |
| Daily Pivot Point S1 | 0.8992 |
| Daily Pivot Point S2 | 0.8940 |
| Daily Pivot Point S3 | 0.8897 |
| Daily Pivot Point R1 | 0.9088 |
| Daily Pivot Point R2 | 0.9131 |
| Daily Pivot Point R3 | 0.9184 |
[/s2If]
Download Nehcap EAWe have two EAs that are operational on our LIVE accounts.
- EA-FIX: Check out the details here. Download EA-FIX . EA-FIX is a non-grid HFT scalper.
- EA-GROWTH: High quality low dd EA using trend grids. Download EA_GROWTHJoin Our Telegram Group


