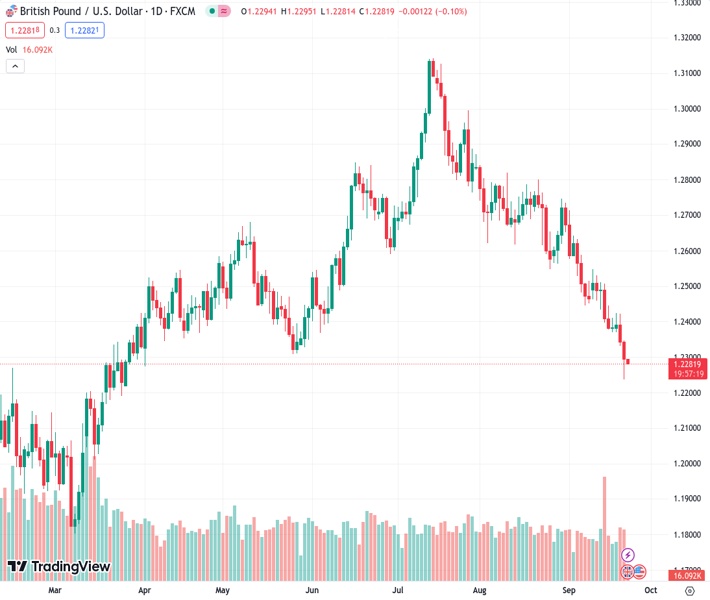
The GBPUSD currency pair, currently valued at 1.22859, continues to face difficulties and is affected by various forces that are exerting downward pressure.
…
This is a premium post.
[s2If !current_user_can(access_s2member_level4)]Please register for FREE REGISTER to read full post below containing analysis. In case of any error or you think you are not able to read the full post below, please email us at support#nehcap.com [lwa][/s2If] [s2If current_user_can(access_s2member_level1)]
- GBP/USD remains on the defensive and is pressured by a combination of factors.
The pair currently trades last at 1.22859.
The previous day high was 1.2352 while the previous day low was 1.2235. The daily 38.2% Fib levels comes at 1.228, expected to provide support. Similarly, the daily 61.8% fib level is at 1.2307, expected to provide resistance.
The GBP/USD pair struggles to capitalize on the previous day’s modest bounce from the 1.2230 area or a nearly six-month low and oscillates in a narrow trading band during the Asian session on Friday. Spot prices remain below the 1.2300 round-figure mark and seem vulnerable to prolonging a well-established downtrend witnessed over the past two months or so.
The US Dollar (USD) holds steady just below its highest level since June touched on Thursday and continues to draw support from the Federal Reserve’s (Fed) hawkish outlook, which, in turn, is seen acting as a headwind for the GBP/USD pair. The Fed decided to keep rates unchanged at a 22-year high, between the 5.25%-5.50% range, as was widely expected, though signalled the possibility of at least one more rate hike by the end of this year in the wake of sticky inflation.
Furthermore, the so-called ‘dot-lot’ indicated that policymakers see the benchmark rate at 5.1% next year, suggesting just two rate cuts in 2024 as compared to four projected previously. This, along with an unexpected drop in the US Weekly Jobless Claims, pushed the yield on the rate-sensitive two-year US government bond to a fresh 17-year peak. Moreover, the 10-year US Treasury yield climbs to the highest since November 2007 and underpins the Greenback.
A sharp rise in the US Treasury bond yields, meanwhile, fuels concerns about economic headwinds stemming from rapidly rising borrowing costs and tempers investors’ appetite for riskier assets. This leads to a further decline in the equity markets, which is seen as another factor underpinning the safe-haven buck and exerting some pressure on the GBP/USD pair. The British Pound is further weighed down by the Bank of England’s (BoE) surprise pause on Thursday.
In fact, the UK central bank decided to leave the benchmark interest rate steady at 5.25%, defying expectations of a 25 bps hike to 5.50% in the wake of the recent deceleration of inflation, signs that the UK labour market is cooling and reviving recession fears. Nevertheless, it was the first time since December 2021 that the BoE did not raise interest rates and also lowered its forecast for economic growth in the July-September period to just 0.1% from the previous projection of 0.4%.
The aforementioned fundamental backdrop seems tilted in favour of bearish traders and suggests that the path of least resistance for the GBP/USD pair is to the downside. Hence, any attempted recovery could be seen as a selling opportunity and remain capped. Traders now look to the release of the flash PMI prints from the UK and the US for some meaningful impetus on the last day of the week. Spot prices, meanwhile, seem poised to end in the red for the third straight week.
Technical Levels: Supports and Resistances
GBPUSD currently trading at 1.2286 at the time of writing. Pair opened at 1.2298 and is trading with a change of -0.1 % .
| Overview | Overview.1 | |
|---|---|---|
| 0 | Today last price | 1.2286 |
| 1 | Today Daily Change | -0.0012 |
| 2 | Today Daily Change % | -0.1000 |
| 3 | Today daily open | 1.2298 |
The pair remains strongly bearish on the daily time frame. It trades below the 20 SMA @ 1.2507, 50 SMA 1.2683, 100 SMA @ 1.2647 and 200 SMA @ 1.2434.
| Trends | Trends.1 | |
|---|---|---|
| 0 | Daily SMA20 | 1.2507 |
| 1 | Daily SMA50 | 1.2683 |
| 2 | Daily SMA100 | 1.2647 |
| 3 | Daily SMA200 | 1.2434 |
The previous day high was 1.2352 while the previous day low was 1.2235. The daily 38.2% Fib levels comes at 1.228, expected to provide support. Similarly, the daily 61.8% fib level is at 1.2307, expected to provide resistance.
Note the levels of interest below:
- Pivot support is noted at 1.2238, 1.2179, 1.2122
- Pivot resistance is noted at 1.2355, 1.2411, 1.2471
| Levels | Levels.1 |
|---|---|
| Previous Daily High | 1.2352 |
| Previous Daily Low | 1.2235 |
| Previous Weekly High | 1.2548 |
| Previous Weekly Low | 1.2379 |
| Previous Monthly High | 1.2841 |
| Previous Monthly Low | 1.2548 |
| Daily Fibonacci 38.2% | 1.2280 |
| Daily Fibonacci 61.8% | 1.2307 |
| Daily Pivot Point S1 | 1.2238 |
| Daily Pivot Point S2 | 1.2179 |
| Daily Pivot Point S3 | 1.2122 |
| Daily Pivot Point R1 | 1.2355 |
| Daily Pivot Point R2 | 1.2411 |
| Daily Pivot Point R3 | 1.2471 |
[/s2If]
Download Nehcap EAWe have two EAs that are operational on our LIVE accounts.
- EA-FIX: Check out the details here. Download EA-FIX . EA-FIX is a non-grid HFT scalper.
- EA-GROWTH: High quality low dd EA using trend grids. Download EA_GROWTHJoin Our Telegram Group


