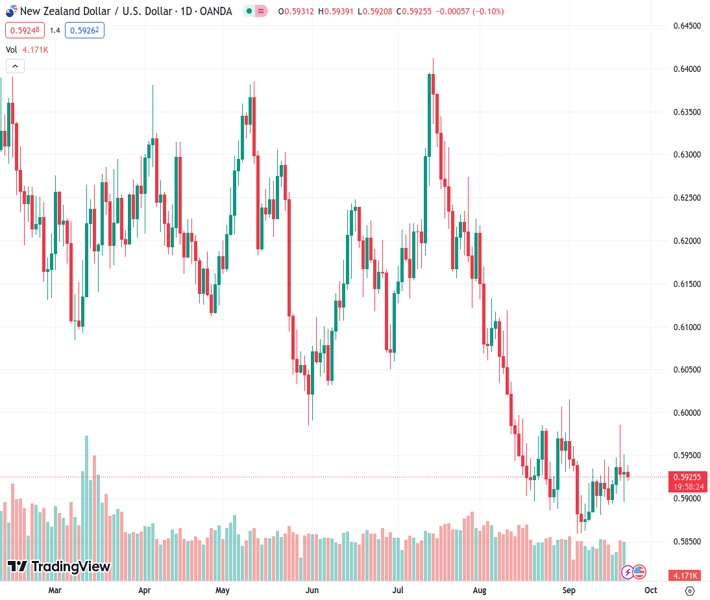
The NZDUSD pair is drawing in some sellers near the 0.5925 level due to the Federal Reserve’s more hawkish position.
…
This is a premium post.
[s2If !current_user_can(access_s2member_level4)]Please register for FREE REGISTER to read full post below containing analysis. In case of any error or you think you are not able to read the full post below, please email us at support#nehcap.com [lwa][/s2If] [s2If current_user_can(access_s2member_level1)]
- NZD/USD attracts some sellers around 0.5925 amid the Fed’s hawkish stance.
The pair currently trades last at 0.59258.
The previous day high was 0.5955 while the previous day low was 0.5896. The daily 38.2% Fib levels comes at 0.5932, expected to provide resistance. Similarly, the daily 61.8% fib level is at 0.5918, expected to provide support.
The NZD/USD pair loses traction after seeing a rejection at 0.5940 during the early Asian session on Friday. The pair currently trades near 0.5925, down 0.10% on the day. The mixed New Zealand Trade Balance data and the upbeat growth number fail to impress the pair as investors digest the outcome of the Federal Reserve (Fed) meeting on Wednesday.
The latest data released by Statistics New Zealand on Friday revealed that the nation’s Trade Balance (NZD) dropped to $-2,291M MoM in August versus $-1,107M prior. The annual trade deficit improved to $15.54B for the said month versus $-15.88B prior figures. Additionally, Exports eased to $4.99B during the said month versus $5.38B prior whereas Imports improved to $7.28B compared to $6.55B in previous readings.
Earlier on Thursday, New Zealand’s economy expanded 0.9% during the second quarter, following 0% in the previous reading. Annually, the second-quarter GDP expanded by 1.8%, compared with the 2.2% growth in Q1 while beating estimates of a 1.2% increase. The upbeat GDP figures might startle the Reserve Bank of New Zealand (RBNZ), which has said that slower growth is needed to curb inflation. These figures could lead to rates holding at their highest level in more than 14 years for longer than expected.
On the USD front, the hawkish stance from the Federal Reserve (Fed) continues to boost the US Dollar (USD) across the board. That said, Fed Chairman Jerome Powell reaffirmed the US central bank’s commitment to achieving a 2% inflation target in a press conference while mentioning that the Fed is ready to raise rates if necessary. This, in turn, lifts the Greenback and acts as a headwind for the NZD/USD pair.
About the data, the weekly Initial Jobless Claims dropped to 201K, the lowest level since January. Meanwhile, the Philly Fed dropped to -13.5 in September from 12.0 in the previous reading, worse than expected of -0.7. Existing Home Sales fell to 4.04M MoM in August from the previous reading of 4.07M.
Looking ahead, market players will take cues from the preliminary US S&P Global/CIPS PMI data for September due on Friday. These figures could give a clear direction to the NZD/USD pair.
Technical Levels: Supports and Resistances
NZDUSD currently trading at 0.5925 at the time of writing. Pair opened at 0.5931 and is trading with a change of -0.1 % .
| Overview | Overview.1 | |
|---|---|---|
| 0 | Today last price | 0.5925 |
| 1 | Today Daily Change | -0.0006 |
| 2 | Today Daily Change % | -0.1000 |
| 3 | Today daily open | 0.5931 |
The pair is trading above its 20 Daily moving average @ 0.5919, below its 50 Daily moving average @ 0.6026 , below its 100 Daily moving average @ 0.61 and below its 200 Daily moving average @ 0.619
| Trends | Trends.1 | |
|---|---|---|
| 0 | Daily SMA20 | 0.5919 |
| 1 | Daily SMA50 | 0.6026 |
| 2 | Daily SMA100 | 0.6100 |
| 3 | Daily SMA200 | 0.6190 |
The previous day high was 0.5955 while the previous day low was 0.5896. The daily 38.2% Fib levels comes at 0.5932, expected to provide resistance. Similarly, the daily 61.8% fib level is at 0.5918, expected to provide support.
Note the levels of interest below:
- Pivot support is noted at 0.59, 0.5868, 0.584
- Pivot resistance is noted at 0.5959, 0.5986, 0.6018
| Levels | Levels.1 |
|---|---|
| Previous Daily High | 0.5955 |
| Previous Daily Low | 0.5896 |
| Previous Weekly High | 0.5945 |
| Previous Weekly Low | 0.5880 |
| Previous Monthly High | 0.6219 |
| Previous Monthly Low | 0.5885 |
| Daily Fibonacci 38.2% | 0.5932 |
| Daily Fibonacci 61.8% | 0.5918 |
| Daily Pivot Point S1 | 0.5900 |
| Daily Pivot Point S2 | 0.5868 |
| Daily Pivot Point S3 | 0.5840 |
| Daily Pivot Point R1 | 0.5959 |
| Daily Pivot Point R2 | 0.5986 |
| Daily Pivot Point R3 | 0.6018 |
[/s2If]
Download Nehcap EAWe have two EAs that are operational on our LIVE accounts.
- EA-FIX: Check out the details here. Download EA-FIX . EA-FIX is a non-grid HFT scalper.
- EA-GROWTH: High quality low dd EA using trend grids. Download EA_GROWTHJoin Our Telegram Group


