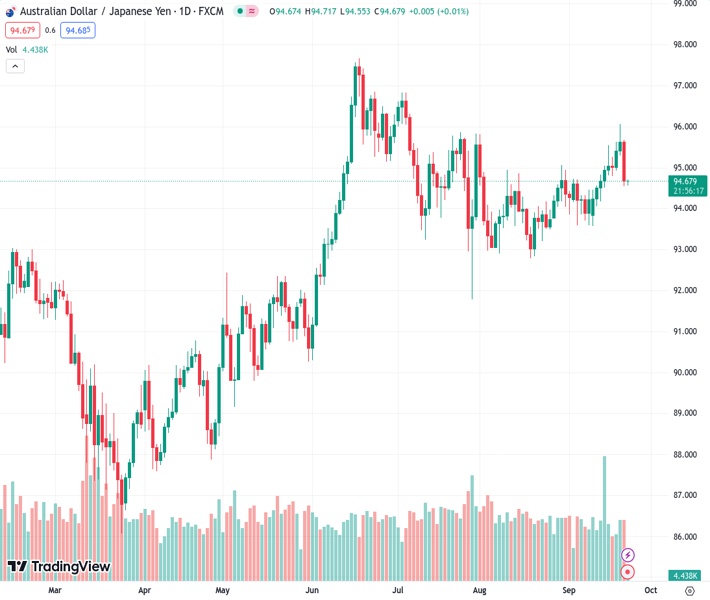
The AUDJPY pair has moved down from 96.06 to 94.67, mainly due to central banks’ emphasis on rising inflation and a negative market sentiment.
…
This is a premium post.
[s2If !current_user_can(access_s2member_level4)]Please register for FREE REGISTER to read full post below containing analysis. In case of any error or you think you are not able to read the full post below, please email us at support#nehcap.com [lwa][/s2If] [s2If current_user_can(access_s2member_level1)]
- AUD/JPY retraces from 96.06 to 94.67, influenced by central banks’ focus on high inflation and a sour market mood.
The pair currently trades last at 94.6600.
The previous day high was 96.08 while the previous day low was 95.3. The daily 38.2% Fib levels comes at 95.79, expected to provide resistance. Similarly, the daily 61.8% fib level is at 95.6, expected to provide resistance.
The AUD/JPY retraces from weekly highs of 96.06 extended its losses past the 95.00 figure, spurred by a sour market mood, as global central banks remain focused on tackling sticky high inflation. Hence, the pair dropped 1% or 95 pips on Thursday, and as the Asian session commences, it hovers around 94.67 flat.
The daily chart depicts the pair as neutral biased, but the AUD/JPY has fallen inside the Ichimoku Cloud (Kumo), which could open the door for further downside. The cross-currency pair first support would be the Kijun-Sen at 94.43, followed by an upslope support trendline at 94.30. Once cleared, the next support would be the Senkou Span B at 93.93, followed by the bottom of the Kumo at 93.80.
Short-term, the AUD/JPY pair is in a downtrend, below the Kumo, with price action below the Kijun and Tenkan-Sen lines, respectively. At the same time, the Chikou Span is also below the Kumo and price action, meaning the pair is bearish-biased. However, recent price action suggests an upward correction could be on the cards, with the pair set to edge towards the 50% Fibonacci retracement at 94.88. Once reached, the pair could extend its losses past the September 21 low of 94.53, followed by the 94.00 figure.
Technical Levels: Supports and Resistances
AUDJPY currently trading at 94.69 at the time of writing. Pair opened at 95.65 and is trading with a change of -1.0 % .
| Overview | Overview.1 | |
|---|---|---|
| 0 | Today last price | 94.69 |
| 1 | Today Daily Change | -0.96 |
| 2 | Today Daily Change % | -1.00 |
| 3 | Today daily open | 95.65 |
The pair remains strongly bullish on the daily timeframe. It trades above its 20 SMA @ 94.53, 50 SMA 94.37, 100 SMA @ 93.95 and 200 SMA @ 92.06.
| Trends | Trends.1 | |
|---|---|---|
| 0 | Daily SMA20 | 94.53 |
| 1 | Daily SMA50 | 94.37 |
| 2 | Daily SMA100 | 93.95 |
| 3 | Daily SMA200 | 92.06 |
The previous day high was 96.08 while the previous day low was 95.3. The daily 38.2% Fib levels comes at 95.79, expected to provide resistance. Similarly, the daily 61.8% fib level is at 95.6, expected to provide resistance.
Note the levels of interest below:
- Pivot support is noted at 95.27, 94.9, 94.49
- Pivot resistance is noted at 96.05, 96.46, 96.83
| Levels | Levels.1 |
|---|---|
| Previous Daily High | 96.08 |
| Previous Daily Low | 95.30 |
| Previous Weekly High | 95.55 |
| Previous Weekly Low | 93.65 |
| Previous Monthly High | 95.81 |
| Previous Monthly Low | 92.79 |
| Daily Fibonacci 38.2% | 95.79 |
| Daily Fibonacci 61.8% | 95.60 |
| Daily Pivot Point S1 | 95.27 |
| Daily Pivot Point S2 | 94.90 |
| Daily Pivot Point S3 | 94.49 |
| Daily Pivot Point R1 | 96.05 |
| Daily Pivot Point R2 | 96.46 |
| Daily Pivot Point R3 | 96.83 |
[/s2If]
Download Nehcap EAWe have two EAs that are operational on our LIVE accounts.
- EA-FIX: Check out the details here. Download EA-FIX . EA-FIX is a non-grid HFT scalper.
- EA-GROWTH: High quality low dd EA using trend grids. Download EA_GROWTHJoin Our Telegram Group


