The EUR/USD currency pair weakened initially due to the Federal Reserve’s hawkish sentiment, but managed to regain its value and close the day unchanged on Thursday.
…
This is a premium post.
[s2If !current_user_can(access_s2member_level4)]Please register for FREE REGISTER to read full post below containing analysis. In case of any error or you think you are not able to read the full post below, please email us at support#nehcap.com [lwa][/s2If] [s2If current_user_can(access_s2member_level1)]
- EUR/USD slips on hawkish Fed but recovers Thursday to end the day flat.
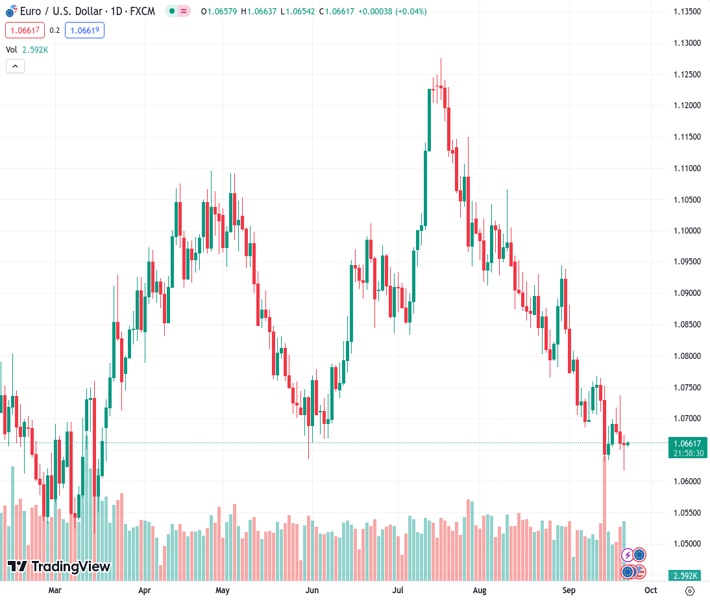
The pair currently trades last at 1.06614.
The previous day high was 1.0737 while the previous day low was 1.065. The daily 38.2% Fib levels comes at 1.0683, expected to provide resistance. Similarly, the daily 61.8% fib level is at 1.0704, expected to provide resistance.
The EUR/USD slid further down the charts on Thursday, testing into new six-month lows near 1.0617 before recovering from the bottom to close out the day near 1.0660 and now heads into the Friday market session with the Greenback (USD) taking a step back.
The Federal Reserve held benchmark interest rates at 5.5% as markets broadly expected on Wednesday, but the US central bank is seeing interest rates holding higher for longer than previously anticipated, and the Fed now only expects interest rates to cut by half a percent by the end of 2024.
With the hawkish outlook in the books, US equities declined and US Treasury yields spiked higher, sending the US Dollar index higher across the entire global currency space, and the Euro fell to a new low.
The EUR/USD pair is already decidedly bearish, having closed in the red for the past nine consecutive weeks. This week will only break the near-term trend if markets are able to push the Euro higher and hold ground before Friday’s closing bell.
Friday’s Purchasing Manager Index (PMI) figures are expected to twist, with the EU forecast to see a slight decline and a minor uptick in US numbers.
European PMI composite is slated to come in at 46.5 versus the previous 46.7, while the US side sees manufacturing rising from 57.9 to an even 48, and the services PMI component lifting from 50.5 to 50.6.
The EUR/USD is currently trapped into the 34-hour Exponential Moving Average (EMA), and sitting on the bearish side of the 200-hour Simple Moving Average (SMA) currently parked just north of 1.0690.
The Euro is rising from Thursday’s low of 1.0620, but the pair is still significantly off Wednesday’s peak at 1.0737.
On the daily charts, the EUR/USD spun out a hammer candlestick, and technical indicators are starting to flash oversold conditions.
The Relative Strength Index (RSI) and Moving Average Convergence-Divergence (MACD) indicators are on the low end and threatening to turn bullish, and a recovery from here could see the EUR/USD set to make another challenge run at the descending trendline from July’s swing high into 1.1250.
Technical Levels: Supports and Resistances
EURUSD currently trading at 1.0662 at the time of writing. Pair opened at 1.066 and is trading with a change of 0.02 % .
| Overview | Overview.1 | |
|---|---|---|
| 0 | Today last price | 1.0662 |
| 1 | Today Daily Change | 0.0002 |
| 2 | Today Daily Change % | 0.0200 |
| 3 | Today daily open | 1.0660 |
The pair remains strongly bearish on the daily time frame. It trades below the 20 SMA @ 1.0753, 50 SMA 1.0908, 100 SMA @ 1.0885 and 200 SMA @ 1.0829.
| Trends | Trends.1 | |
|---|---|---|
| 0 | Daily SMA20 | 1.0753 |
| 1 | Daily SMA50 | 1.0908 |
| 2 | Daily SMA100 | 1.0885 |
| 3 | Daily SMA200 | 1.0829 |
The previous day high was 1.0737 while the previous day low was 1.065. The daily 38.2% Fib levels comes at 1.0683, expected to provide resistance. Similarly, the daily 61.8% fib level is at 1.0704, expected to provide resistance.
Note the levels of interest below:
- Pivot support is noted at 1.0628, 1.0596, 1.0541
- Pivot resistance is noted at 1.0715, 1.0769, 1.0802
| Levels | Levels.1 |
|---|---|
| Previous Daily High | 1.0737 |
| Previous Daily Low | 1.0650 |
| Previous Weekly High | 1.0769 |
| Previous Weekly Low | 1.0632 |
| Previous Monthly High | 1.1065 |
| Previous Monthly Low | 1.0766 |
| Daily Fibonacci 38.2% | 1.0683 |
| Daily Fibonacci 61.8% | 1.0704 |
| Daily Pivot Point S1 | 1.0628 |
| Daily Pivot Point S2 | 1.0596 |
| Daily Pivot Point S3 | 1.0541 |
| Daily Pivot Point R1 | 1.0715 |
| Daily Pivot Point R2 | 1.0769 |
| Daily Pivot Point R3 | 1.0802 |
[/s2If]
Download Nehcap EAWe have two EAs that are operational on our LIVE accounts.
- EA-FIX: Check out the details here. Download EA-FIX . EA-FIX is a non-grid HFT scalper.
- EA-GROWTH: High quality low dd EA using trend grids. Download EA_GROWTHJoin Our Telegram Group


