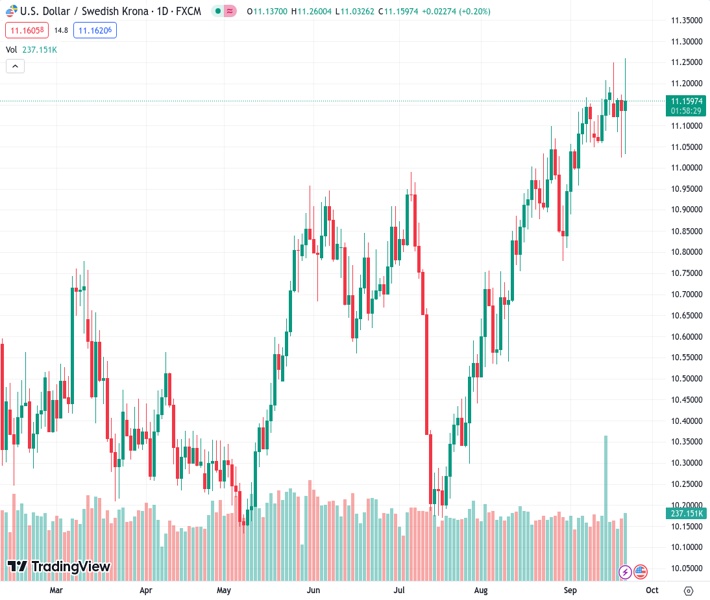
The exchange rate between the US dollar and the Swedish Krona, represented as USDSEK, rose from 11.15888 to 11.247, indicating a 1% increase. However, it then declined and returned to a value of 11.152.
…
This is a premium post.
[s2If !current_user_can(access_s2member_level4)]Please register for FREE REGISTER to read full post below containing analysis. In case of any error or you think you are not able to read the full post below, please email us at support#nehcap.com [lwa][/s2If] [s2If current_user_can(access_s2member_level1)]
- USD/SEK increased to 11.247, seeing a 1% gains and then retreated to 11.152.
The pair currently trades last at 11.15888.
The previous day high was 11.1784 while the previous day low was 11.0275. The daily 38.2% Fib levels comes at 11.0851, expected to provide support. Similarly, the daily 61.8% fib level is at 11.1208, expected to provide support.
On Thursday’s session, the USD/SEK climbed to its highest level since October 2022, towards 11.247, seeing 1% daily gains, but failed to hold its momentum and settled at 11.152. On the SEK’s side, the Swedish Riksbank hiked rates by 25 bps and sounded hawkish, while on the USD side, the Greenback eased during the American session, and seems to be consolidating gains.
The Swedish Riksbank announced on Thursday that it would hike rates from 3.75% to 4% as widely anticipated. In the policy statement, the bank commented that progress was being made, but inflation remained too high, noting that further hikes may be necessary. In the meantime, markets are discounting that the Riksbank will deliver one final hike in November to end the tightening cycle, mainly due to concerns over the health of the Swedish economy, amongst the worst performers in Europe.
On the US side, the Federal Reserve (Fed) held rates steady on Wednesday. Still, their Summary of Economic Projections (SEP) revealed that the median rate forecast of the Federal Open Market Committee (FOMC) members stood at 5.6% for 2023, meaning that one more hike in on the table. In addition, the rate projections 2024 were revised to 5.1% and virtually delayed rate cuts. These hawkish projections boosted the US yields, which trade in multi-year highs as investors are bracing for one more hike by the Fed and rates being higher for longer. The 10-year bond yield reached 4.47% while the two and 5-year yield rose to 5.14% and 4.61%, respectively. That being said, the DXY index found support at a high near 105.70 and eased to 105.30 but the expectations of a more aggressive Fed will likely limit its losses.
The USD/SEK daily chart signals a bullish sentiment for the short term. The Relative Strength Index (RSI) is favourably positioned in positive territory above its midline, reflecting an upward movement. Similarly, Moving Average Convergence Divergence (MACD) depicts green bars, affirming the bullish momentum. In addition, the pair is above the 20,100,200-day Simple Moving Average (SMA), implying that the bulls retain control on a broader scale.
Support levels: 11.150, 11.070 (20-day SMA), 11.000.
Resistance levels: 11.289, 11.300, 11.406.
Technical Levels: Supports and Resistances
USDSEK currently trading at 11.1504 at the time of writing. Pair opened at 11.1427 and is trading with a change of 0.07 % .
| Overview | Overview.1 | |
|---|---|---|
| 0 | Today last price | 11.1504 |
| 1 | Today Daily Change | 0.0077 |
| 2 | Today Daily Change % | 0.0700 |
| 3 | Today daily open | 11.1427 |
The pair remains strongly bullish on the daily timeframe. It trades above its 20 SMA @ 11.0788, 50 SMA 10.7827, 100 SMA @ 10.7289 and 200 SMA @ 10.5746.
| Trends | Trends.1 | |
|---|---|---|
| 0 | Daily SMA20 | 11.0788 |
| 1 | Daily SMA50 | 10.7827 |
| 2 | Daily SMA100 | 10.7289 |
| 3 | Daily SMA200 | 10.5746 |
The previous day high was 11.1784 while the previous day low was 11.0275. The daily 38.2% Fib levels comes at 11.0851, expected to provide support. Similarly, the daily 61.8% fib level is at 11.1208, expected to provide support.
Note the levels of interest below:
- Pivot support is noted at 11.054, 10.9653, 10.9031
- Pivot resistance is noted at 11.2049, 11.2671, 11.3558
| Levels | Levels.1 |
|---|---|
| Previous Daily High | 11.1784 |
| Previous Daily Low | 11.0275 |
| Previous Weekly High | 11.2085 |
| Previous Weekly Low | 11.0496 |
| Previous Monthly High | 11.0993 |
| Previous Monthly Low | 10.4126 |
| Daily Fibonacci 38.2% | 11.0851 |
| Daily Fibonacci 61.8% | 11.1208 |
| Daily Pivot Point S1 | 11.0540 |
| Daily Pivot Point S2 | 10.9653 |
| Daily Pivot Point S3 | 10.9031 |
| Daily Pivot Point R1 | 11.2049 |
| Daily Pivot Point R2 | 11.2671 |
| Daily Pivot Point R3 | 11.3558 |
[/s2If]
Download Nehcap EAWe have two EAs that are operational on our LIVE accounts.
- EA-FIX: Check out the details here. Download EA-FIX . EA-FIX is a non-grid HFT scalper.
- EA-GROWTH: High quality low dd EA using trend grids. Download EA_GROWTHJoin Our Telegram Group


