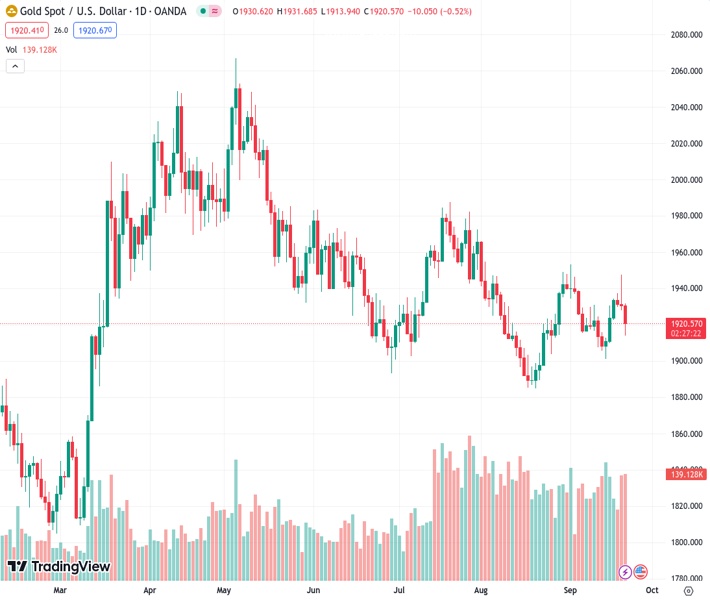
The price of XAUUSD, which is currently at 1,920.41, decreases by 0.56% and settles at $1919.74. This is driven by the Federal Reserve’s choice to keep rates unchanged and increase them, leading to an increase in gold prices.
…
This is a premium post.
[s2If !current_user_can(access_s2member_level4)]Please register for FREE REGISTER to read full post below containing analysis. In case of any error or you think you are not able to read the full post below, please email us at support#nehcap.com [lwa][/s2If] [s2If current_user_can(access_s2member_level1)]
- XAU/USD drops 0.56% to $1919.74 as the Fed’s decision to maintain and revise rates upward pressures gold prices.
The pair currently trades last at 1920.41.
The previous day high was 1947.47 while the previous day low was 1927.99. The daily 38.2% Fib levels comes at 1935.43, expected to provide resistance. Similarly, the daily 61.8% fib level is at 1940.03, expected to provide resistance.
Gold price slides for the third straight day against the US Dollar (USD), following the Federal Reserve’s hawkish hold that bolstered the Greenback. Hence, higher US Treasury bond yields rose, while the XAU/USD traded at $1919.74, losing 0.56% after reaching a daily high of $1931.57.
The aftermath of the US central bank decision keeps market participants averse to risk. US equities are dropping, US Treasury bond yields skyrocket, and the Greenback stays firm above the 105.00 threshold.
Jerome Powell and his colleagues’ decision to hold rates while upward revising the Federal Funds Rate (FFR) for 2024 from 44.6% to 5.1% was the reason behind the market’s reaction. Even though policymakers see another 25 bps rate hike toward the end of the year, market participants remain skeptical about a hike in November, but not so much in December. The odds of a 25 bps hike in the former are 26.3%, while the latter stands at 38.4%.
That spurred Gold’s fall, as US Treasury bond yields skyrocketed, while US real yields reached a year-to-date (YTD) high at 2.115%, as shown by US 10-year TIPS (Treasury Inflation-Protected Securities).
Additionally, more central banks kept rates unchanged but stressed the need to add to the Fed’s mantra of holding rates “higher for longer.” The Bank of England (BoE) kept rates at 5.25% but maintained the door open for additional rate increases. Also, the Swiss National Bank (SNB) held its policy rates unchanged at 1.75% and warned about future tightening.
On the data front, US unemployment claims for the week ending on September 16 rose below estimates of 225K at 201K. The Philadelphia Fed Manufacturing Index, a gauge for business activity, plummeted to -13.5, below forecasts of -0.7, while Existing Home Sales for August improved to -0.7% MoM, compared to July -2.2% plunge.
After spiking due to the Fed’s decision day, the XAU/USD retraced and printed a daily close below the 50-day moving average (DMA) at $1930.40, with the yellow metal extending its losses past the Asian session. As price action continued to drop, the XAU/USD broke crucial technical support levels, like the confluence of the 20 and 200-DMA at around $1925.00/58, exposing the non-yielding metal to additional selling pressure. Next, support emerges at the September 14 swing low of $1901.11, followed by the August 21 swing low of $1884.89.
Technical Levels: Supports and Resistances
XAUUSD currently trading at 1920.15 at the time of writing. Pair opened at 1930.34 and is trading with a change of -0.53 % .
| Overview | Overview.1 | |
|---|---|---|
| 0 | Today last price | 1920.15 |
| 1 | Today Daily Change | -10.19 |
| 2 | Today Daily Change % | -0.53 |
| 3 | Today daily open | 1930.34 |
The pair remains strongly bearish on the daily time frame. It trades below the 20 SMA @ 1925.31, 50 SMA 1931.44, 100 SMA @ 1944.49 and 200 SMA @ 1924.26.
| Trends | Trends.1 | |
|---|---|---|
| 0 | Daily SMA20 | 1925.31 |
| 1 | Daily SMA50 | 1931.44 |
| 2 | Daily SMA100 | 1944.49 |
| 3 | Daily SMA200 | 1924.26 |
The previous day high was 1947.47 while the previous day low was 1927.99. The daily 38.2% Fib levels comes at 1935.43, expected to provide resistance. Similarly, the daily 61.8% fib level is at 1940.03, expected to provide resistance.
Note the levels of interest below:
- Pivot support is noted at 1923.06, 1915.79, 1903.58
- Pivot resistance is noted at 1942.54, 1954.75, 1962.02
| Levels | Levels.1 |
|---|---|
| Previous Daily High | 1947.47 |
| Previous Daily Low | 1927.99 |
| Previous Weekly High | 1930.77 |
| Previous Weekly Low | 1901.07 |
| Previous Monthly High | 1966.08 |
| Previous Monthly Low | 1884.85 |
| Daily Fibonacci 38.2% | 1935.43 |
| Daily Fibonacci 61.8% | 1940.03 |
| Daily Pivot Point S1 | 1923.06 |
| Daily Pivot Point S2 | 1915.79 |
| Daily Pivot Point S3 | 1903.58 |
| Daily Pivot Point R1 | 1942.54 |
| Daily Pivot Point R2 | 1954.75 |
| Daily Pivot Point R3 | 1962.02 |
[/s2If]
Download Nehcap EAWe have two EAs that are operational on our LIVE accounts.
- EA-FIX: Check out the details here. Download EA-FIX . EA-FIX is a non-grid HFT scalper.
- EA-GROWTH: High quality low dd EA using trend grids. Download EA_GROWTHJoin Our Telegram Group


