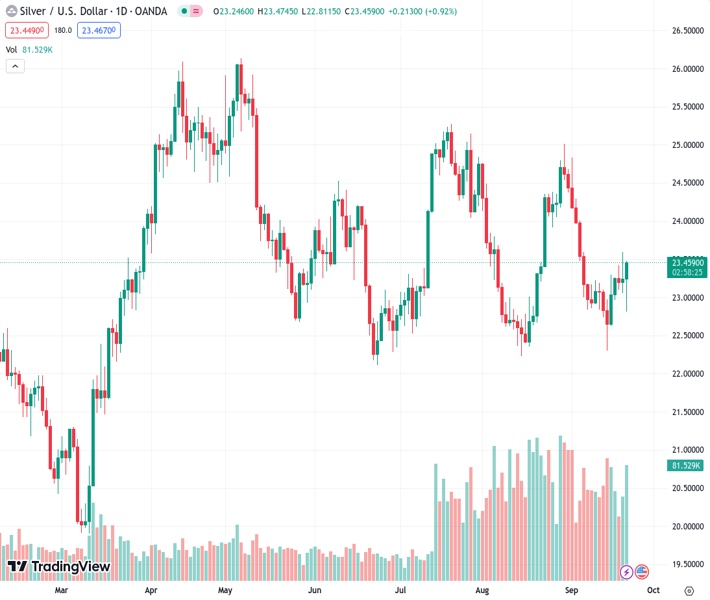
The XAGUSD, at a price of 23.459, initially dropped to a low point of 22.80 before bouncing back to 23.40.
…
This is a premium post.
[s2If !current_user_can(access_s2member_level4)]Please register for FREE REGISTER to read full post below containing analysis. In case of any error or you think you are not able to read the full post below, please email us at support#nehcap.com [lwa][/s2If] [s2If current_user_can(access_s2member_level1)]
- After failing to a low of $22.80, the XAG/USD recovered to $23.40.
The pair currently trades last at 23.459.
The previous day high was 23.59 while the previous day low was 23.05. The daily 38.2% Fib levels comes at 23.39, expected to provide support. Similarly, the daily 61.8% fib level is at 23.26, expected to provide support.
On Thursday, the XAG/USD Silver Spot price found support at $22.80 and then climbed back to $23.40 On the downside, higher US yields favour a bearish outlook for Silver in the short term, while poor Manufacturing data from the US softened the USD, allowing the metal to find demand.
The Philadelphia Fed Manufacturing Survey is a proxy of manufacturing conditions from September, came in lower than expected at -13.5. On the upside, Initial Jobless Claims for the week ending in September 15 of the US came in below the expectations at 201,000, lower than the 225,000 expected and the previous 221,000.
It is worth noticing that, as Chair Powell stated on Wednesday, the Federal Reserve (Fed) will remain data-dependent so that economic figures will set the pace of the US Dollar until the next decision. In addition, the policy statement revealed that most members are seeing an additional hike in 2023, while the projections pushed back cuts from 2024 to September. In that sense, expectations of higher rates for a longer time fueled US bond yield, limiting the XAG/USD upside potential.
In the meantime, the 2-year yield stands at 5.14% while the 5 and 10-year rates at 4.60% and 4.46%, all three in multi-year highs. The Greenback, measured by the DXY index, retreated from it highest level since March 9 of 105.73 towards 105.40 following the data and allowed the XAG/USD to gather some momentum.
Analyzing the daily chart, a bearish outlook is seen for the short term regarding XAG/USD despite indicators turning flat. The metal is below the 20,100 and 200-day Simple Moving Averages (SMAs), pointing towards the prevailing strength of the bears in the larger context; those averages are about to perform a bearish cross at the $23.50 area.
Support levels: $23.00, $22.80, $22.50.
Resistance levels: $23.50 (20,100 and 200-day SMA convergence), $23.70, $24.00
Technical Levels: Supports and Resistances
XAGUSD currently trading at 23.42 at the time of writing. Pair opened at 23.25 and is trading with a change of 0.73 % .
| Overview | Overview.1 | |
|---|---|---|
| 0 | Today last price | 23.42 |
| 1 | Today Daily Change | 0.17 |
| 2 | Today Daily Change % | 0.73 |
| 3 | Today daily open | 23.25 |
The pair remains strongly bearish on the daily time frame. It trades below the 20 SMA @ 23.58, 50 SMA 23.72, 100 SMA @ 23.67 and 200 SMA @ 23.47.
| Trends | Trends.1 | |
|---|---|---|
| 0 | Daily SMA20 | 23.58 |
| 1 | Daily SMA50 | 23.72 |
| 2 | Daily SMA100 | 23.67 |
| 3 | Daily SMA200 | 23.47 |
The previous day high was 23.59 while the previous day low was 23.05. The daily 38.2% Fib levels comes at 23.39, expected to provide support. Similarly, the daily 61.8% fib level is at 23.26, expected to provide support.
Note the levels of interest below:
- Pivot support is noted at 23.0, 22.76, 22.46
- Pivot resistance is noted at 23.54, 23.84, 24.08
| Levels | Levels.1 |
|---|---|
| Previous Daily High | 23.59 |
| Previous Daily Low | 23.05 |
| Previous Weekly High | 23.29 |
| Previous Weekly Low | 22.30 |
| Previous Monthly High | 25.02 |
| Previous Monthly Low | 22.23 |
| Daily Fibonacci 38.2% | 23.39 |
| Daily Fibonacci 61.8% | 23.26 |
| Daily Pivot Point S1 | 23.00 |
| Daily Pivot Point S2 | 22.76 |
| Daily Pivot Point S3 | 22.46 |
| Daily Pivot Point R1 | 23.54 |
| Daily Pivot Point R2 | 23.84 |
| Daily Pivot Point R3 | 24.08 |
[/s2If]
Download Nehcap EAWe have two EAs that are operational on our LIVE accounts.
- EA-FIX: Check out the details here. Download EA-FIX . EA-FIX is a non-grid HFT scalper.
- EA-GROWTH: High quality low dd EA using trend grids. Download EA_GROWTHJoin Our Telegram Group


