The US dollar to Mexican peso exchange rate, currently at 17.1826, rises to 17.1637, experiencing a 0.43% increase, driven by the Federal Reserve’s cautious stance on monetary policy and their optimistic outlook on future interest rates.
…
This is a premium post.
[s2If !current_user_can(access_s2member_level4)]Please register for FREE REGISTER to read full post below containing analysis. In case of any error or you think you are not able to read the full post below, please email us at support#nehcap.com [lwa][/s2If] [s2If current_user_can(access_s2member_level1)]
- USD/MXN climbs to 17.1637, up 0.43%, fueled by the Fed’s hawkish hold and upward revisions of future interest rates.
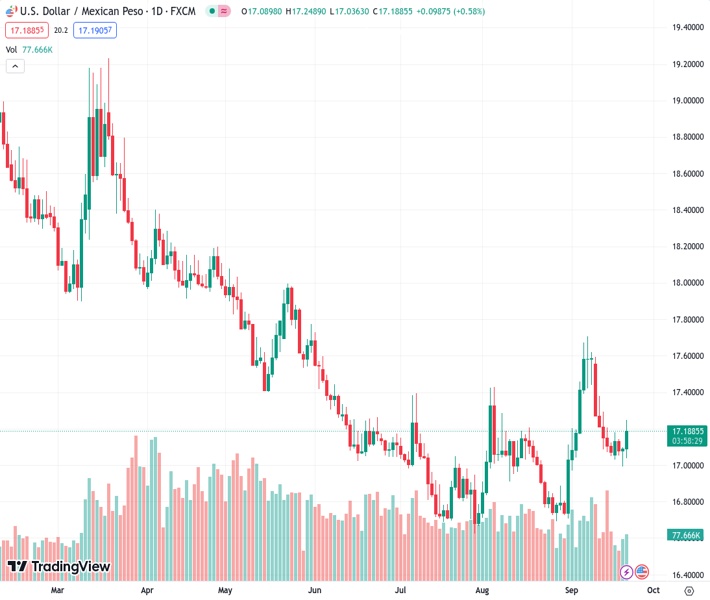
The pair currently trades last at 17.1826.
The previous day high was 17.1 while the previous day low was 16.9982. The daily 38.2% Fib levels comes at 17.0611, expected to provide support. Similarly, the daily 61.8% fib level is at 17.0371, expected to provide support.
The Greenback stages a recovery vs. the Mexican Peso on Thursday, spurred by a hawkish hold by the US Federal Reserve. Although economic data from Mexico showed consumer spending remains strong despite higher interest rates, the pair edges higher. The USD/MXN is trading at 17.1637, up 0.43% after printing a low of 17.0363.
On Wednesday, the US central bank decided to keep rates at their current level while updating its economic forecasts. The monetary policy statement acknowledged a strong labor market, tightening credit conditions, and expanding economy. They emphasized that “Inflation remains elevated” due to the last two inflation readings witnessing an uptick.
However, most market participants were looking for the rest of the year and future projections, as the Fed revealed its Summary of Economic Projections (SEP). Policymakers foresee an additional rate hike in 2023 while revising the Federal Funds rate (FFR) for 2024, with the median seen rates at 5.1%, up from 4.6%.
That has been the main driver of price action since yesterday. The USD/MXN extended its gains, while US Treasury bond yields along the short and medium end of the curve reached multi-year highs, a tailwind for the American Dollar (USD). The US Dollar Index (DXY), a gauge of the buck’s value vs. a basket of peers, remains at 105.39, almost flat, following post-Fed’s reaction.
The US economic agenda recently featured Initial Jobless Claims for the last week came in at 201,000, beating the 225,000 estimates, reflecting a solid labor market. However, the September Philadelphia Fed Manufacturing Index dropped significantly to -13.5, well below the expected -0.5. US Existing Home Sales also fell short of expectations, declining by -0.7% month-on-month, while a 1.5% expansion was projected.
Across the border, the Instituto Nacional de Estadistica Geografia e Informatica (INEGI) revealed that Mexican Retail Sales came at 0.2% MoM in June, aligned with estimates and 5.1% YoY, exceeding 4.9% forecasts.
After the Fed’s decision, the USD/MXN pierced the 17.00 figure before rallying sharply toward the 17.10 area. Since then, the pair seesawed around 17.0500/17.1000 and rallied, reclaiming the 20-day moving average (DMA) at 17.1402, eyeing the 100-DMA at 17.1941. In the outcome of achieving a daily close above that level, the exotic pair could test the September 7 daily high at 17.7074 before challenging 18.0000. On the downside, a drop below the 20-DMA could exacerbate a dip to the 17.0000 psychological level.
Technical Levels: Supports and Resistances
USDMXN currently trading at 17.1836 at the time of writing. Pair opened at 17.0923 and is trading with a change of 0.53 % .
| Overview | Overview.1 | |
|---|---|---|
| 0 | Today last price | 17.1836 |
| 1 | Today Daily Change | 0.0913 |
| 2 | Today Daily Change % | 0.5300 |
| 3 | Today daily open | 17.0923 |
The pair is trading above its 20 Daily moving average @ 17.1281, above its 50 Daily moving average @ 17.0213 , below its 100 Daily moving average @ 17.2079 and below its 200 Daily moving average @ 17.9176
| Trends | Trends.1 | |
|---|---|---|
| 0 | Daily SMA20 | 17.1281 |
| 1 | Daily SMA50 | 17.0213 |
| 2 | Daily SMA100 | 17.2079 |
| 3 | Daily SMA200 | 17.9176 |
The previous day high was 17.1 while the previous day low was 16.9982. The daily 38.2% Fib levels comes at 17.0611, expected to provide support. Similarly, the daily 61.8% fib level is at 17.0371, expected to provide support.
Note the levels of interest below:
- Pivot support is noted at 17.027, 16.9618, 16.9253
- Pivot resistance is noted at 17.1288, 17.1652, 17.2305
| Levels | Levels.1 |
|---|---|
| Previous Daily High | 17.1000 |
| Previous Daily Low | 16.9982 |
| Previous Weekly High | 17.5959 |
| Previous Weekly Low | 17.0504 |
| Previous Monthly High | 17.4274 |
| Previous Monthly Low | 16.6945 |
| Daily Fibonacci 38.2% | 17.0611 |
| Daily Fibonacci 61.8% | 17.0371 |
| Daily Pivot Point S1 | 17.0270 |
| Daily Pivot Point S2 | 16.9618 |
| Daily Pivot Point S3 | 16.9253 |
| Daily Pivot Point R1 | 17.1288 |
| Daily Pivot Point R2 | 17.1652 |
| Daily Pivot Point R3 | 17.2305 |
[/s2If]
Download Nehcap EAWe have two EAs that are operational on our LIVE accounts.
- EA-FIX: Check out the details here. Download EA-FIX . EA-FIX is a non-grid HFT scalper.
- EA-GROWTH: High quality low dd EA using trend grids. Download EA_GROWTHJoin Our Telegram Group


