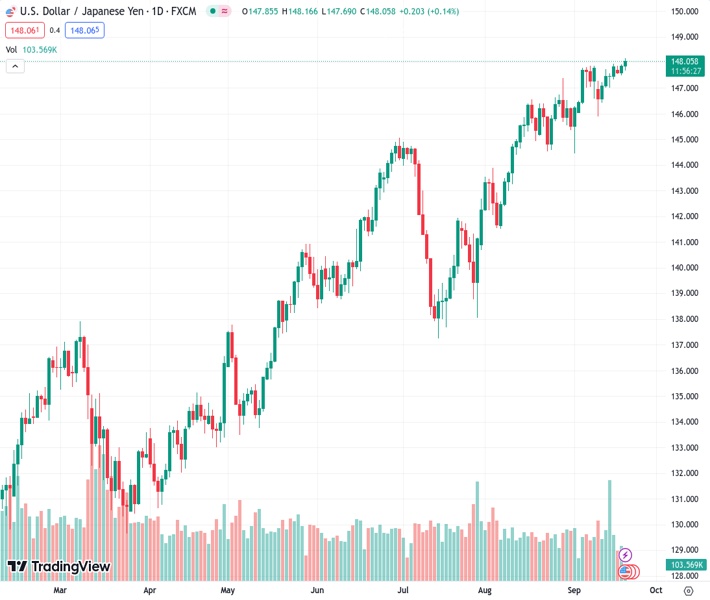
The USDJPY currency pair has risen again for two consecutive days and reached a new peak not seen since November 2022.
…
This is a premium post.
[s2If !current_user_can(access_s2member_level4)]Please register for FREE REGISTER to read full post below containing analysis. In case of any error or you think you are not able to read the full post below, please email us at support#nehcap.com [lwa][/s2If] [s2If current_user_can(access_s2member_level1)]
- USD/JPY scales higher for the second straight day and climbs to a fresh high since November 2022.
The pair currently trades last at 148.071.
The previous day high was 147.92 while the previous day low was 147.51. The daily 38.2% Fib levels comes at 147.76, expected to provide support. Similarly, the daily 61.8% fib level is at 147.67, expected to provide support.
The USD/JPY pair gains some follow-through positive traction for the second successive day on Wednesday and touches a fresh high since November 2022 during the early part of the European session. Spot prices, however, retreat a few pips in the last hour and currently trade just above the 148.00 round-figure mark, up around 0.15% for the day, as traders start repositioning for the highly-anticipated FOMC monetary policy decision.
Growing acceptance that the Federal Reserve (Fed) will stick to its hawkish stance and keep the door open for at least one more rate hike by the end of this year continues to act as a tailwind for the US Dollar (USD). That said, speculations about an imminent shift in the Bank of Japan’s dovish stance, along with fears that authorities will intervene to prop up the Japanese Yen (JPY), keep a lid on any further appreciating move for the USD/JPY pair.
From a technical perspective, sustained strength and acceptance above the 148.00 round-figure mark could be seen as a fresh trigger for bullish traders. Moreover, oscillators on the daily chart are holding in the positive territory and are still far from being in the overbought zone. This, in turn, suggests that the path of least resistance for the USD/JPY pair is to the upside and supports prospects for an extension of the recent upward trajectory.
Hence, some follow-through move towards testing the next relevant hurdle near the 148.80-148.85 region, en route to the 149.00 round figure, looks like a distinct possibility. the momentum could get extended further and lift the USD/JPY pair to the 149.70 area before bulls aim to reclaim the 150.00 psychological mark for the first time since October 2022.
On the flip side, any corrective decline might now find some support near the daily low, around the 147.70-147.65 area, which is closely followed by the weekly trough, around mid-147.00s. A convincing break below the latter might prompt some technical selling and drag the USD/JPY pair back towards the 147.00 round figure. Spot prices might then slide to the 146.50 horizontal support, which if broken will expose last week’s swing low or sub-146.00 levels.
Technical Levels: Supports and Resistances
USDJPY currently trading at 148.05 at the time of writing. Pair opened at 147.86 and is trading with a change of 0.13 % .
| Overview | Overview.1 | |
|---|---|---|
| 0 | Today last price | 148.05 |
| 1 | Today Daily Change | 0.19 |
| 2 | Today Daily Change % | 0.13 |
| 3 | Today daily open | 147.86 |
The pair remains strongly bullish on the daily timeframe. It trades above its 20 SMA @ 146.82, 50 SMA 144.15, 100 SMA @ 142.03 and 200 SMA @ 137.46.
| Trends | Trends.1 | |
|---|---|---|
| 0 | Daily SMA20 | 146.82 |
| 1 | Daily SMA50 | 144.15 |
| 2 | Daily SMA100 | 142.03 |
| 3 | Daily SMA200 | 137.46 |
The previous day high was 147.92 while the previous day low was 147.51. The daily 38.2% Fib levels comes at 147.76, expected to provide support. Similarly, the daily 61.8% fib level is at 147.67, expected to provide support.
Note the levels of interest below:
- Pivot support is noted at 147.61, 147.35, 147.19
- Pivot resistance is noted at 148.02, 148.18, 148.43
| Levels | Levels.1 |
|---|---|
| Previous Daily High | 147.92 |
| Previous Daily Low | 147.51 |
| Previous Weekly High | 147.95 |
| Previous Weekly Low | 145.90 |
| Previous Monthly High | 147.38 |
| Previous Monthly Low | 141.51 |
| Daily Fibonacci 38.2% | 147.76 |
| Daily Fibonacci 61.8% | 147.67 |
| Daily Pivot Point S1 | 147.61 |
| Daily Pivot Point S2 | 147.35 |
| Daily Pivot Point S3 | 147.19 |
| Daily Pivot Point R1 | 148.02 |
| Daily Pivot Point R2 | 148.18 |
| Daily Pivot Point R3 | 148.43 |
[/s2If]
Download Nehcap EAWe have two EAs that are operational on our LIVE accounts.
- EA-FIX: Check out the details here. Download EA-FIX . EA-FIX is a non-grid HFT scalper.
- EA-GROWTH: High quality low dd EA using trend grids. Download EA_GROWTHJoin Our Telegram Group


