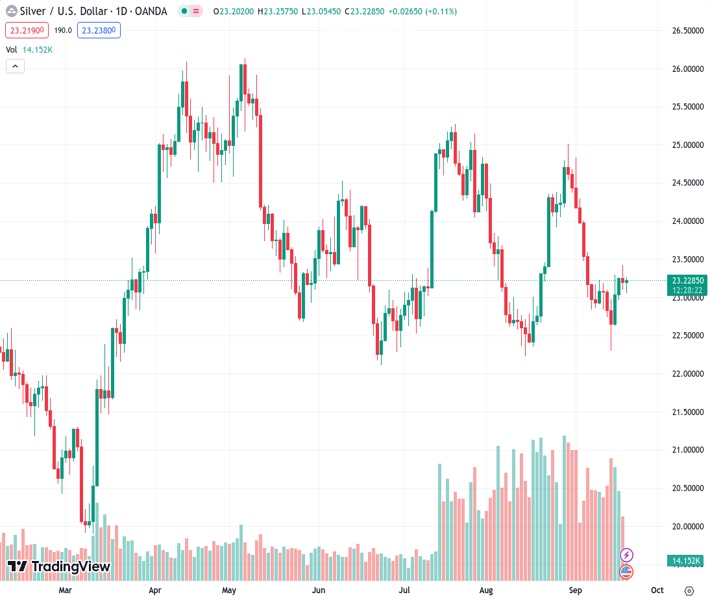
Silver’s price at $23.243 per ounce experienced dip-buying on Wednesday, preventing a decline after reaching its highest level in two weeks.
…
This is a premium post.
[s2If !current_user_can(access_s2member_level4)]Please register for FREE REGISTER to read full post below containing analysis. In case of any error or you think you are not able to read the full post below, please email us at support#nehcap.com [lwa][/s2If] [s2If current_user_can(access_s2member_level1)]
- Silver attracts dip-buying on Wednesday and stalls the overnight pullback from a two-week top.
The pair currently trades last at 23.243.
The previous day high was 23.42 while the previous day low was 23.1. The daily 38.2% Fib levels comes at 23.22, expected to provide support. Similarly, the daily 61.8% fib level is at 23.3, expected to provide resistance.
Silver reverses modest intraday losses to the $23.00 neighbourhood and turns neutral during the early European session on Wednesday, albeit lacks follow-through. The white metal currently trades around the $23.20 area, unchanged for the day, and for now, seems to have stalled its retracement slide from a nearly two-week high touched on Tuesday.
From a technical perspective, the recent goodish rebound from the $22.30 support area – representing an ascending trend line extending from the June monthly low – and the emergence of some dip-buying on Wednesday favours bullish traders. That said, the overnight failure to find acceptance above the 38.2% Fibonacci retracement level of the August-September fall and a pullback from the vicinity of the very important 200-day Simple Moving Average (SMA) warrants some caution.
Moreover, oscillators on the daily chart – though have been recovering from lower levels – are still far from confirming a positive bias. Hence, any subsequent move up might continue to attract fresh sellers and is more likely to remain capped near the 200-day SMA, currently pegged near the $22.40-$22.50 area. A sustained strength beyond, however, might prompt a short-covering rally and lift the XAG/USD to the 100-day SMA barrier, around the $23.80 region, en route to the $24.00 mark.
The next relevant hurdle is pegged near the $24.30-$24.35 region, which if cleared decisively should pave the way for a move towards reclaiming the $25.00 psychological mark. The latter coincides with the August monthly swing high and is followed by the July peak, around the $25.25 region. Some follow-through buying will be seen as a fresh trigger for bullish traders and pave the way for a further near-term appreciating move for the XAG/USD.
On the flip side, the daily trough, around the $23.05 area, now seems to protect the immediate downside, ahead of the 23.6% Fibo. level. Any further decline could find decent support near the $23.30 region, or a nearly one-month low touched last Thursday. Failure to defend the said support levels will confirm a bearish breakdown and make the XAG/USD vulnerable. The white metal could then accelerate the downward trajectory towards the next relevant support near the $21.25 zone before eventually dropping to the $21.00 round-figure mark.
Technical Levels: Supports and Resistances
XAGUSD currently trading at 23.2 at the time of writing. Pair opened at 23.2 and is trading with a change of 0.0 % .
| Overview | Overview.1 | |
|---|---|---|
| 0 | Today last price | 23.2 |
| 1 | Today Daily Change | 0.0 |
| 2 | Today Daily Change % | 0.0 |
| 3 | Today daily open | 23.2 |
The pair remains strongly bearish on the daily time frame. It trades below the 20 SMA @ 23.63, 50 SMA 23.74, 100 SMA @ 23.7 and 200 SMA @ 23.48.
| Trends | Trends.1 | |
|---|---|---|
| 0 | Daily SMA20 | 23.63 |
| 1 | Daily SMA50 | 23.74 |
| 2 | Daily SMA100 | 23.70 |
| 3 | Daily SMA200 | 23.48 |
The previous day high was 23.42 while the previous day low was 23.1. The daily 38.2% Fib levels comes at 23.22, expected to provide support. Similarly, the daily 61.8% fib level is at 23.3, expected to provide resistance.
Note the levels of interest below:
- Pivot support is noted at 23.06, 22.92, 22.73
- Pivot resistance is noted at 23.38, 23.56, 23.71
| Levels | Levels.1 |
|---|---|
| Previous Daily High | 23.42 |
| Previous Daily Low | 23.10 |
| Previous Weekly High | 23.29 |
| Previous Weekly Low | 22.30 |
| Previous Monthly High | 25.02 |
| Previous Monthly Low | 22.23 |
| Daily Fibonacci 38.2% | 23.22 |
| Daily Fibonacci 61.8% | 23.30 |
| Daily Pivot Point S1 | 23.06 |
| Daily Pivot Point S2 | 22.92 |
| Daily Pivot Point S3 | 22.73 |
| Daily Pivot Point R1 | 23.38 |
| Daily Pivot Point R2 | 23.56 |
| Daily Pivot Point R3 | 23.71 |
[/s2If]
Download Nehcap EAWe have two EAs that are operational on our LIVE accounts.
- EA-FIX: Check out the details here. Download EA-FIX . EA-FIX is a non-grid HFT scalper.
- EA-GROWTH: High quality low dd EA using trend grids. Download EA_GROWTHJoin Our Telegram Group


